Biological Age
The number that
outranks your birthday.
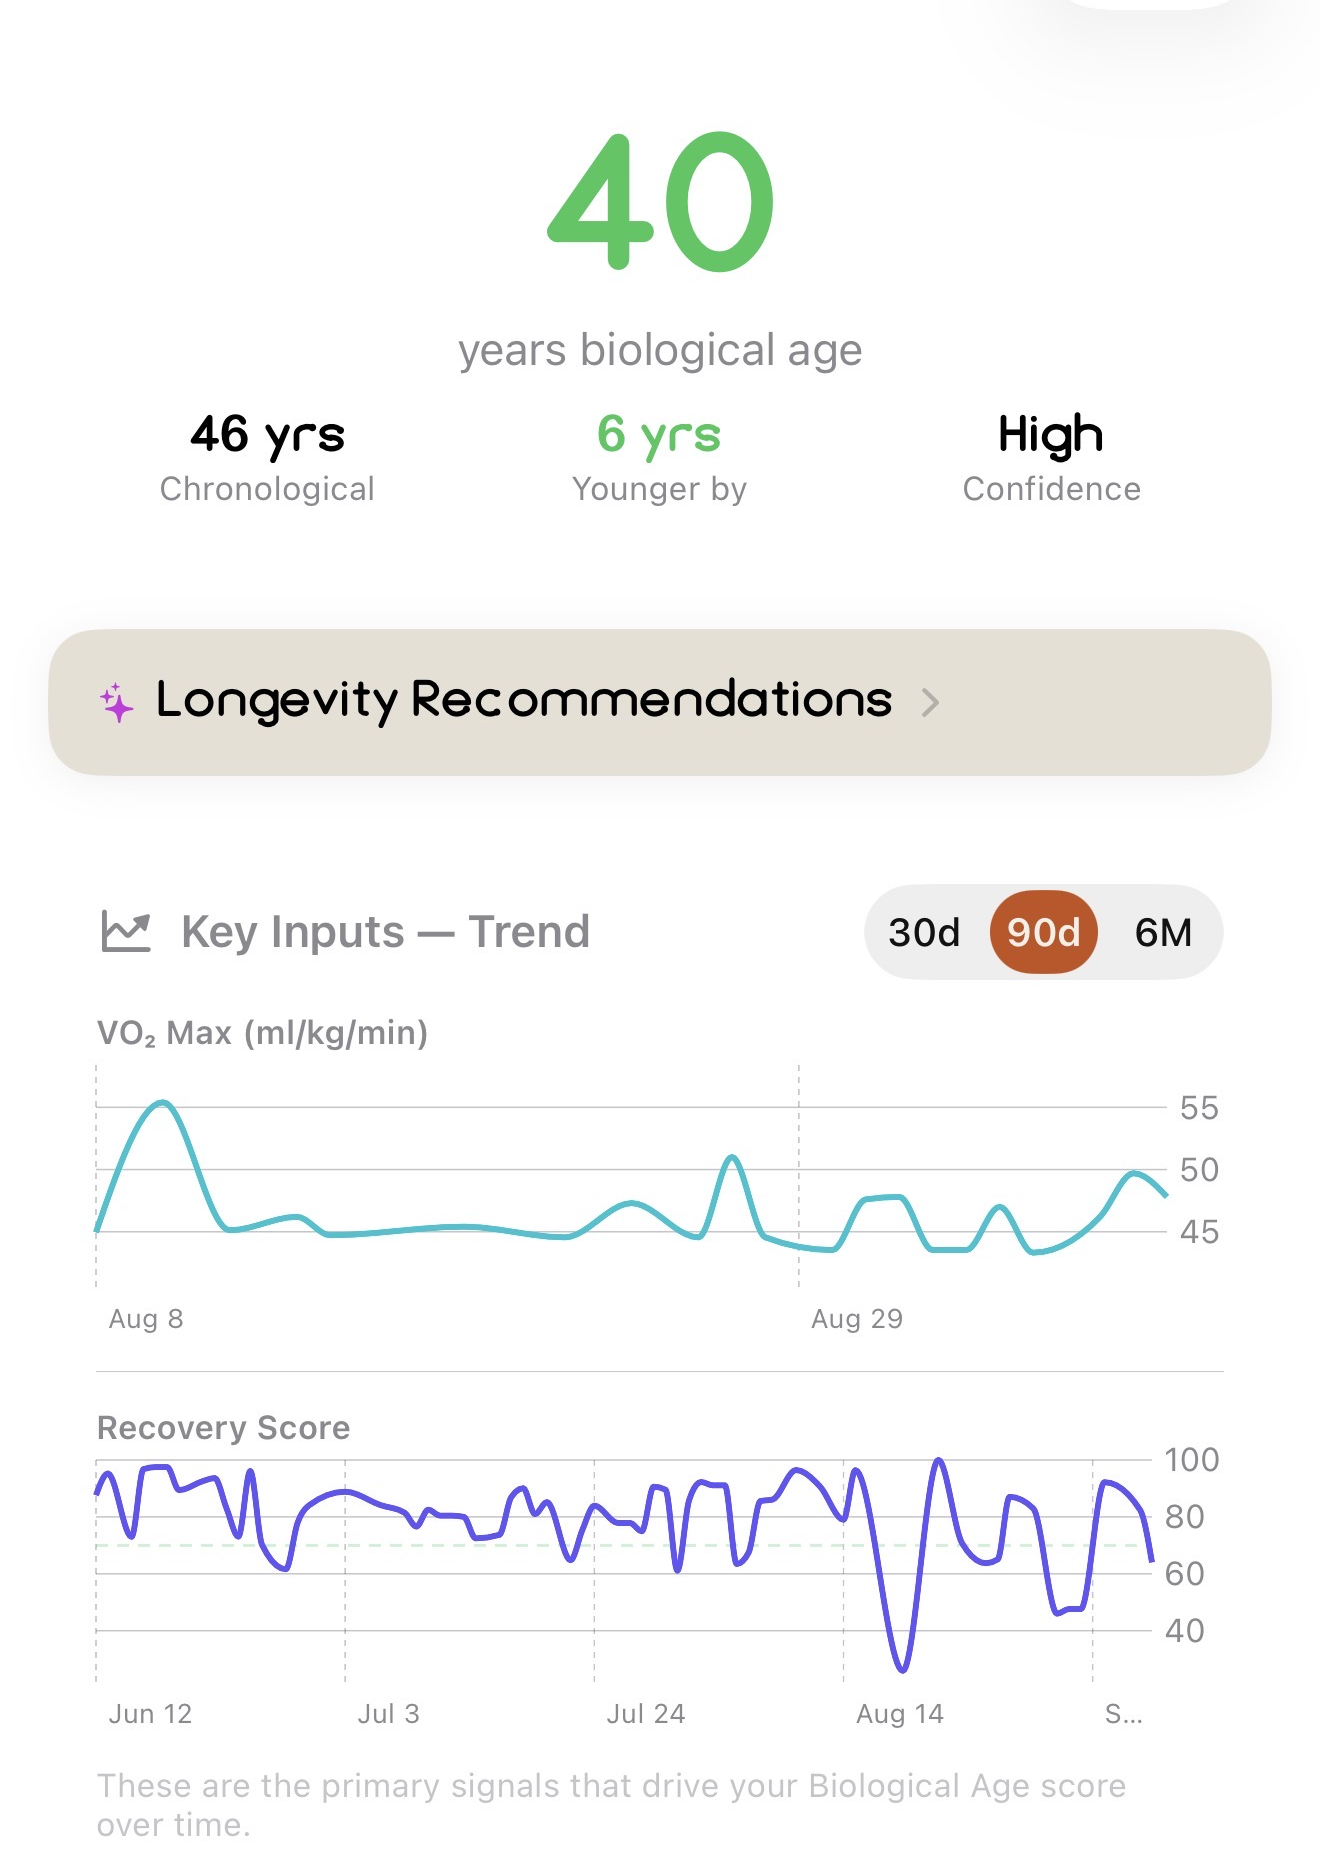
Your chronological age is a fact about the calendar. Your biological age is a fact about your body, and unlike the first one, it moves. Enva builds it from five weighted domains of your own data, and tells you how much to trust the answer.
Coming soon to iPhone.
What goes in
Five domains, weighted by how much they actually predict.
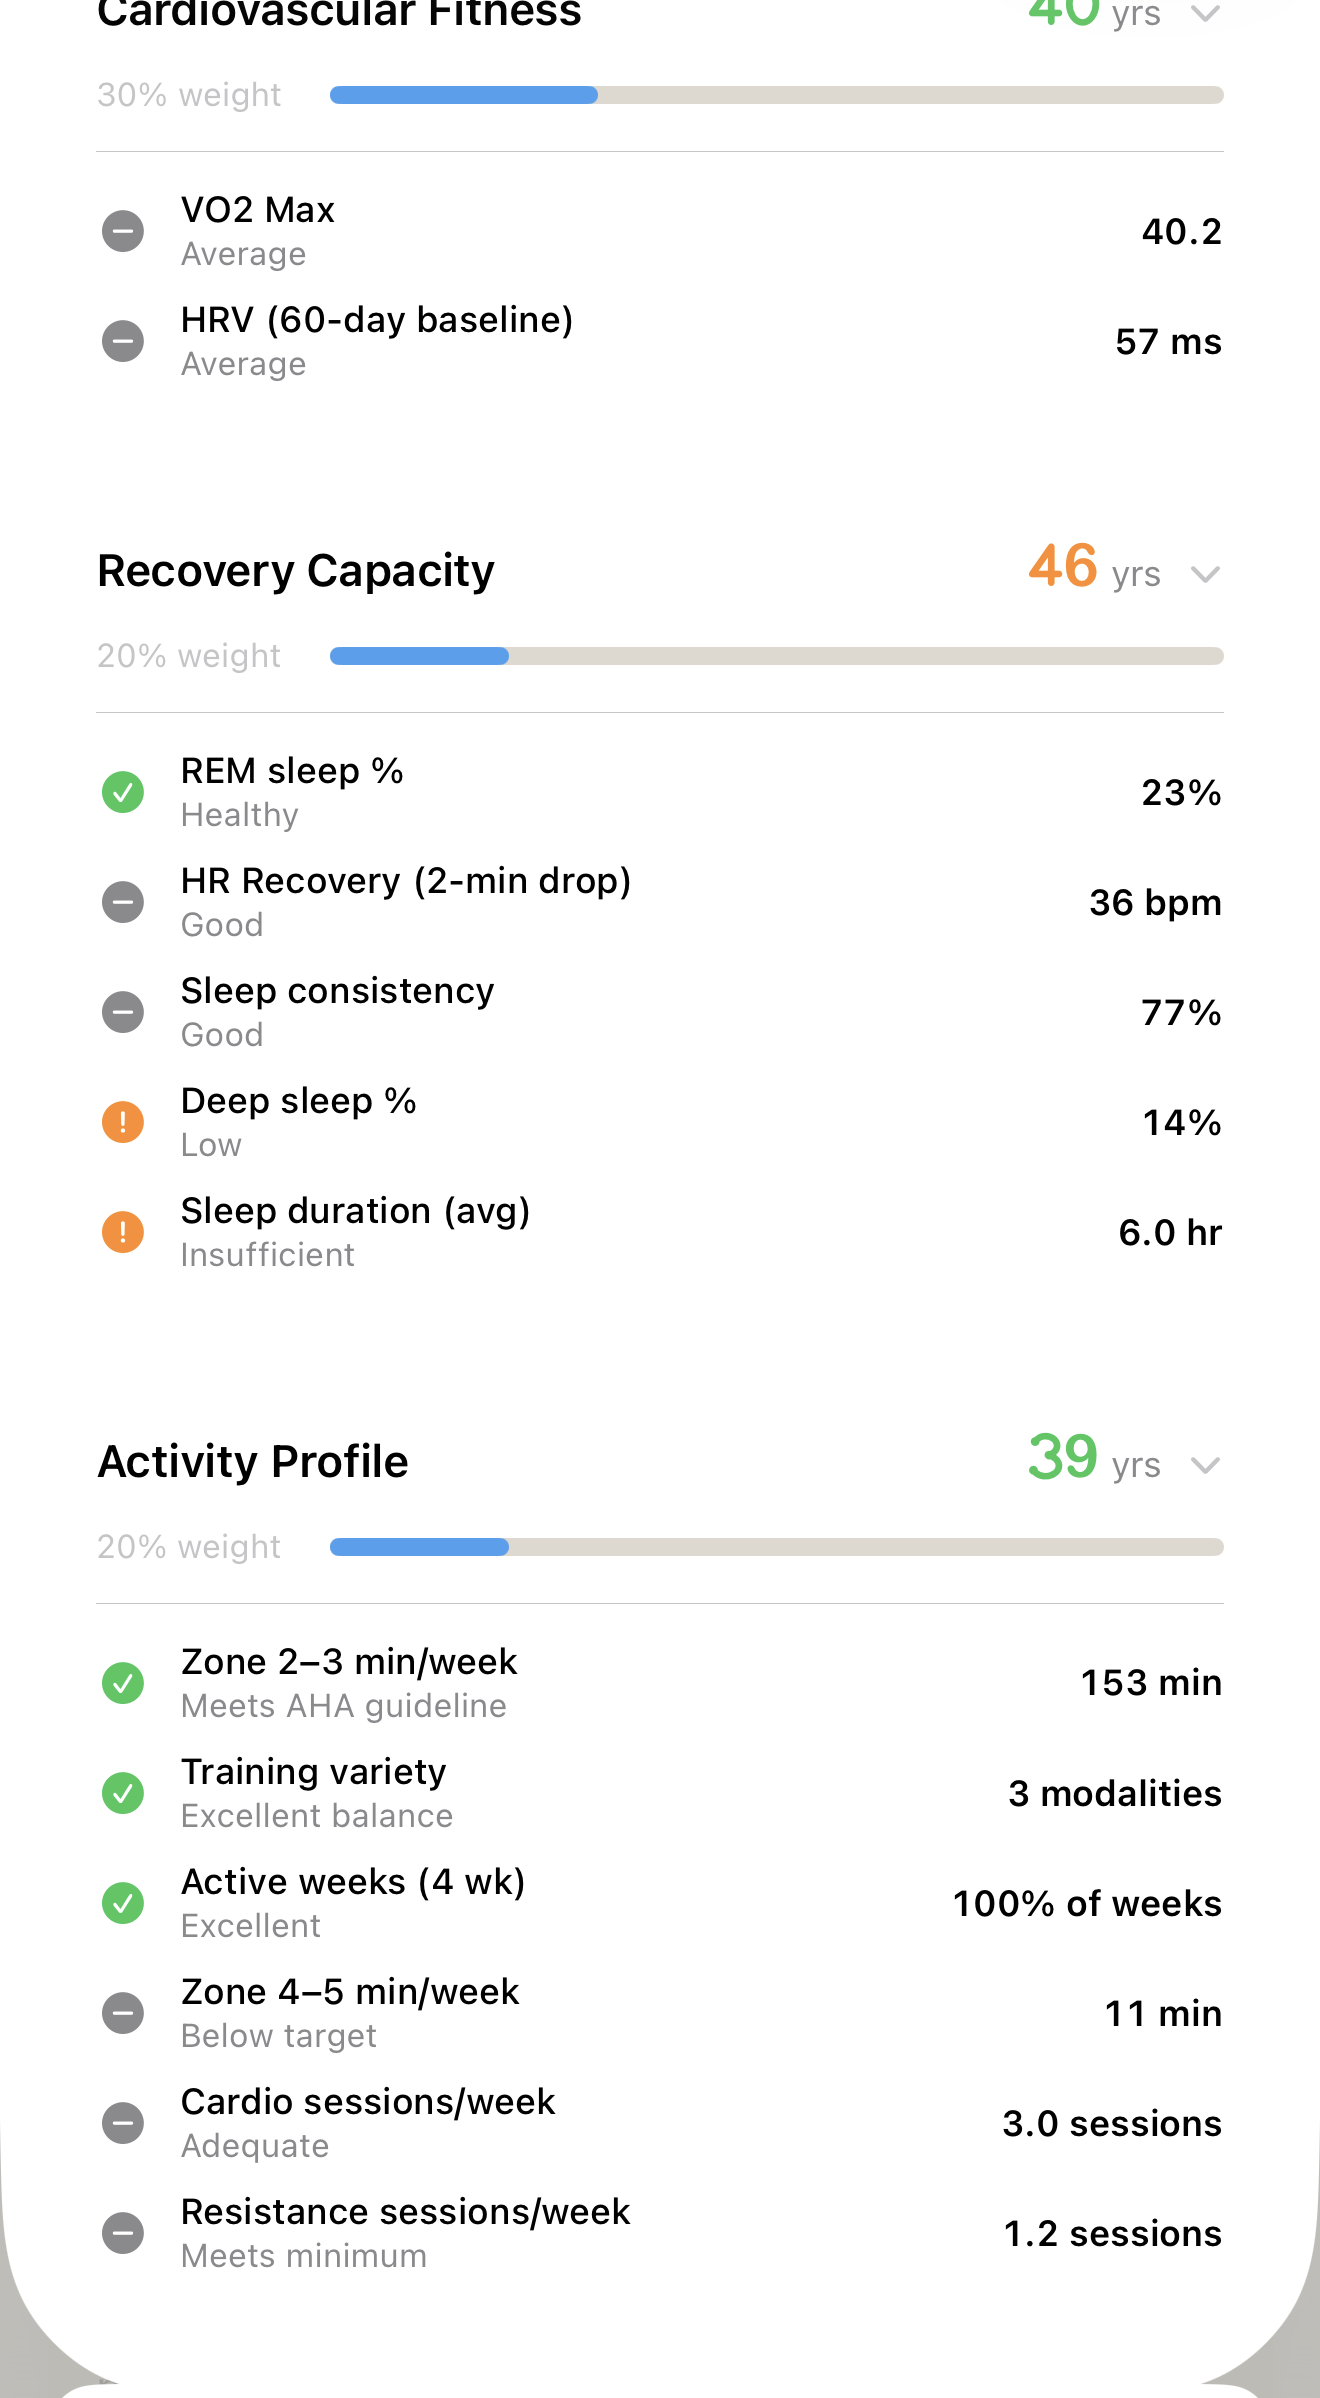
Not every signal deserves an equal vote. Cardiovascular fitness carries the heaviest weight because it is the single strongest modifiable predictor of all-cause mortality in the literature.
Body composition and blood work matter, but they move slower and explain less on their own, so they weigh less. Every domain shows its own age and the exact signals behind it.
30% weight
Cardiovascular Fitness
How efficiently your heart and lungs move oxygen, and how quickly your autonomic system recovers. The heaviest-weighted domain because it is the one most responsive to training.
20% weight
Recovery Capacity
Whether your body actually repairs between sessions. Sleep architecture matters more here than duration alone, so deep and REM percentages carry their own weight.
20% weight
Activity Profile
Not just how much you move, but the shape of it. Zone distribution, resistance work and variety are scored separately, because an athlete who only ever goes hard is not aging the way the volume suggests.
15% weight
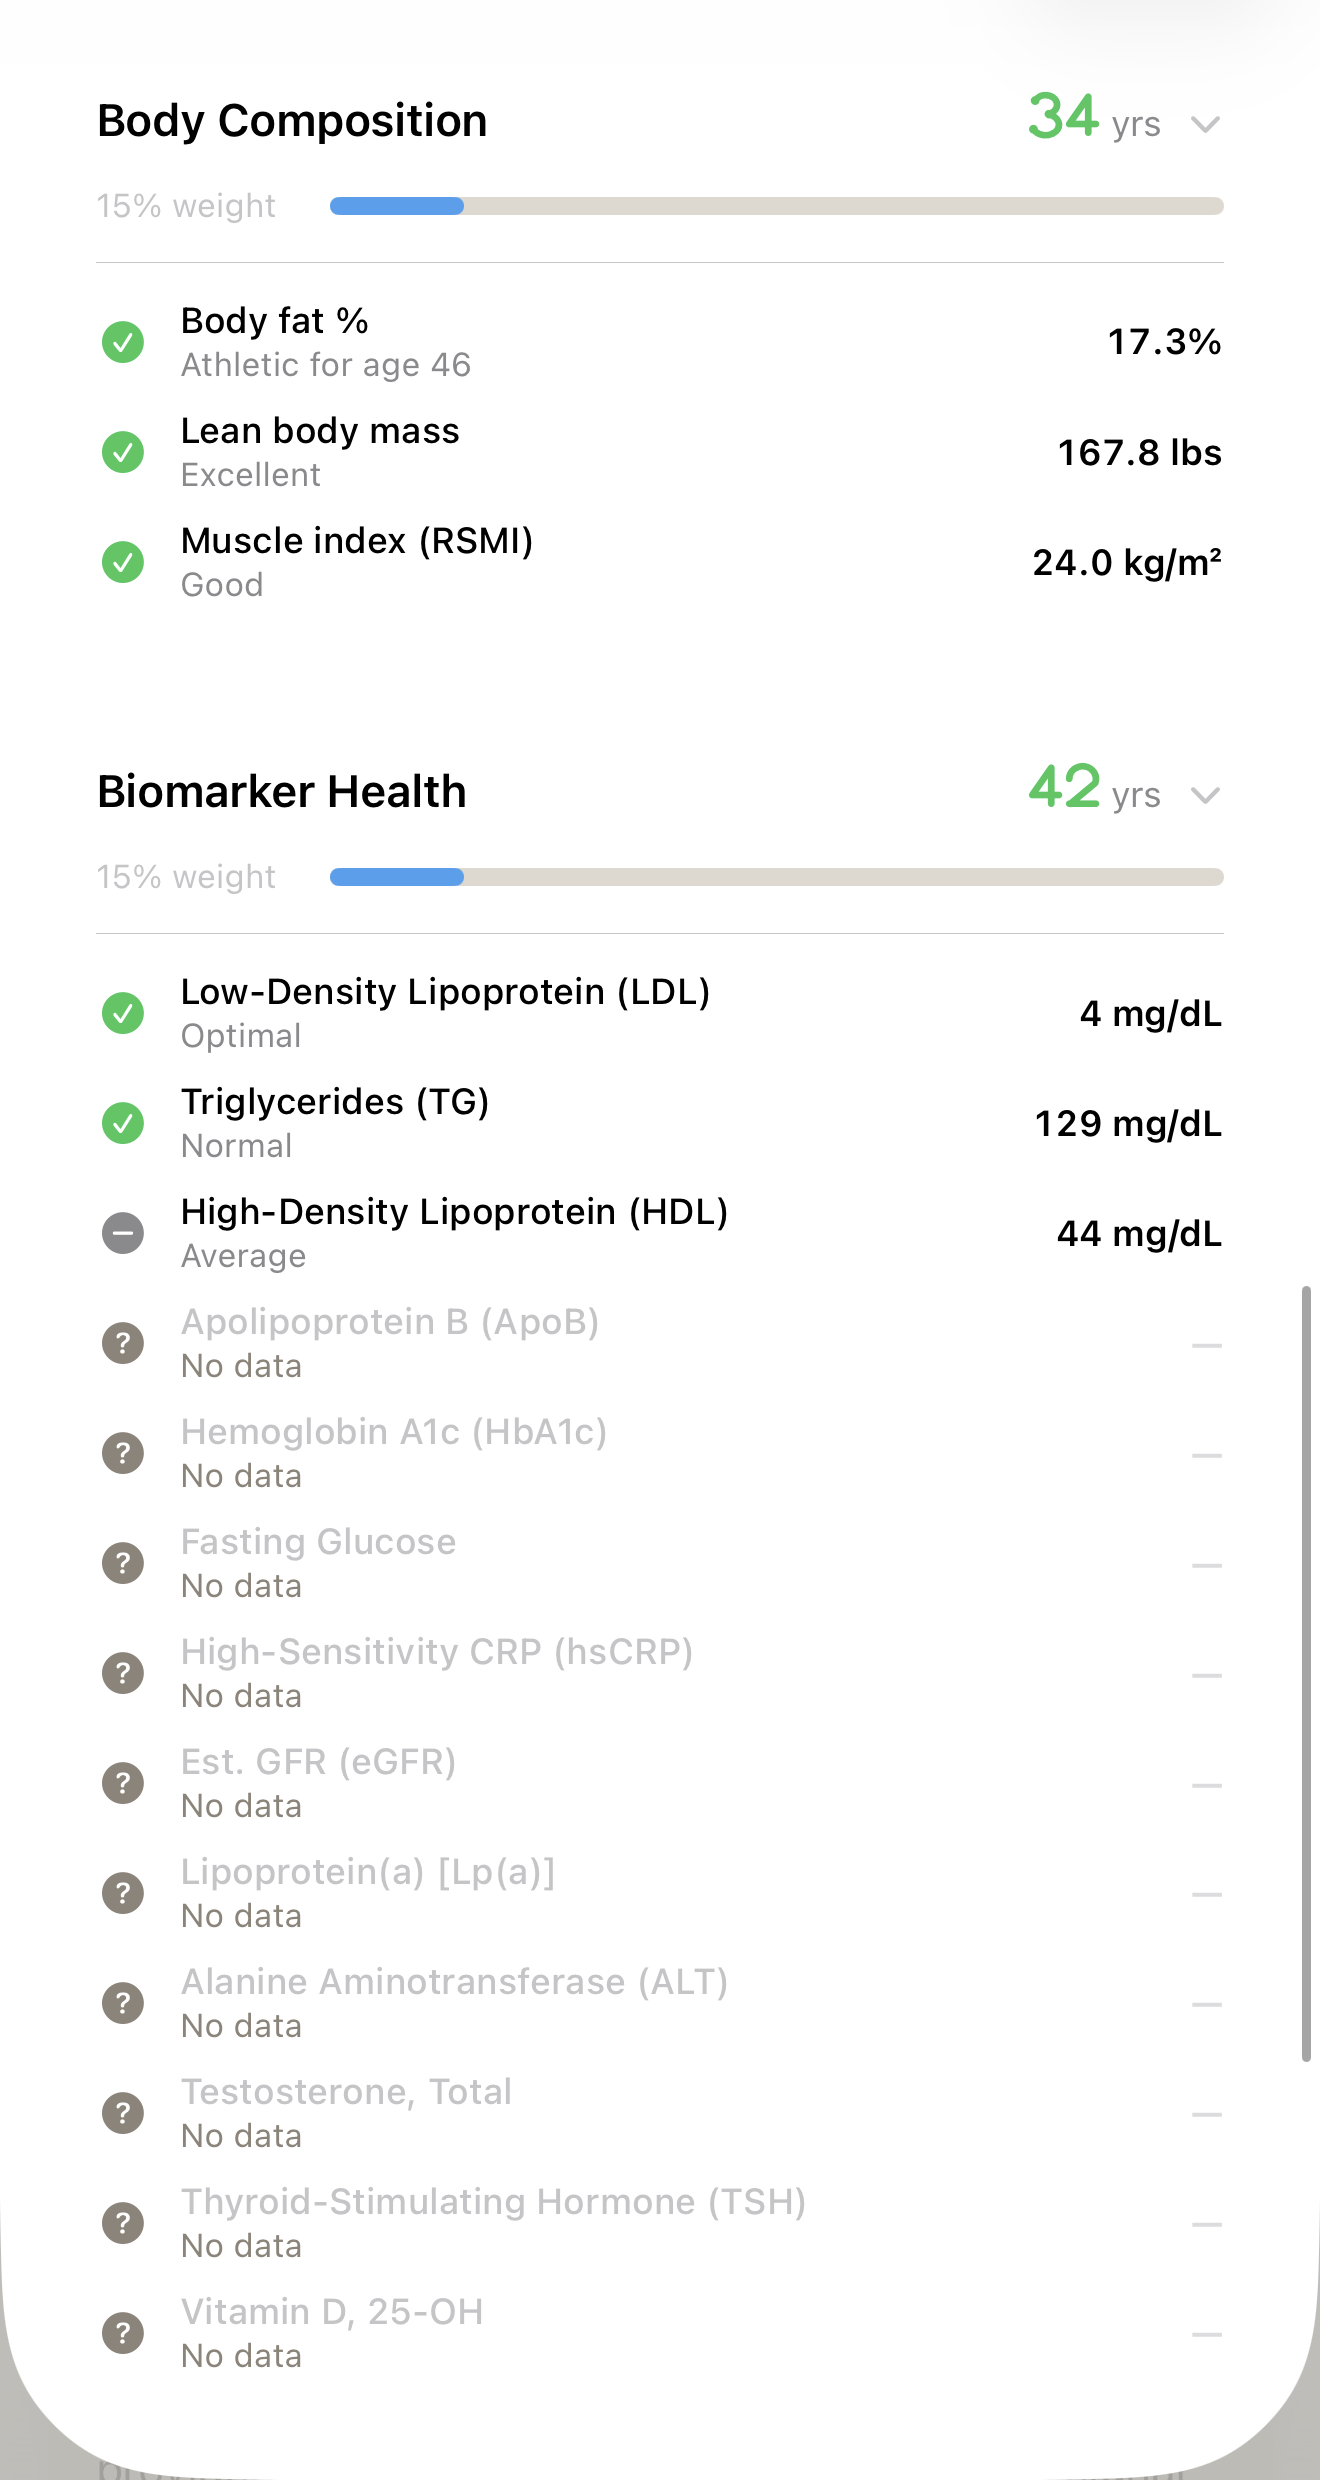
Body Composition
Lean mass is the part that predicts. Muscle index is scored against ethnicity-specific reference ranges, because a single universal cutoff misreads a large share of the population.
15% weight
Biomarker Health
Your labs, read as a system instead of a PDF. Pulled straight from MyChart and scored against clinical reference ranges, then folded into the same number as your training.
Down to the marker
It reads your labs, not just lists them.
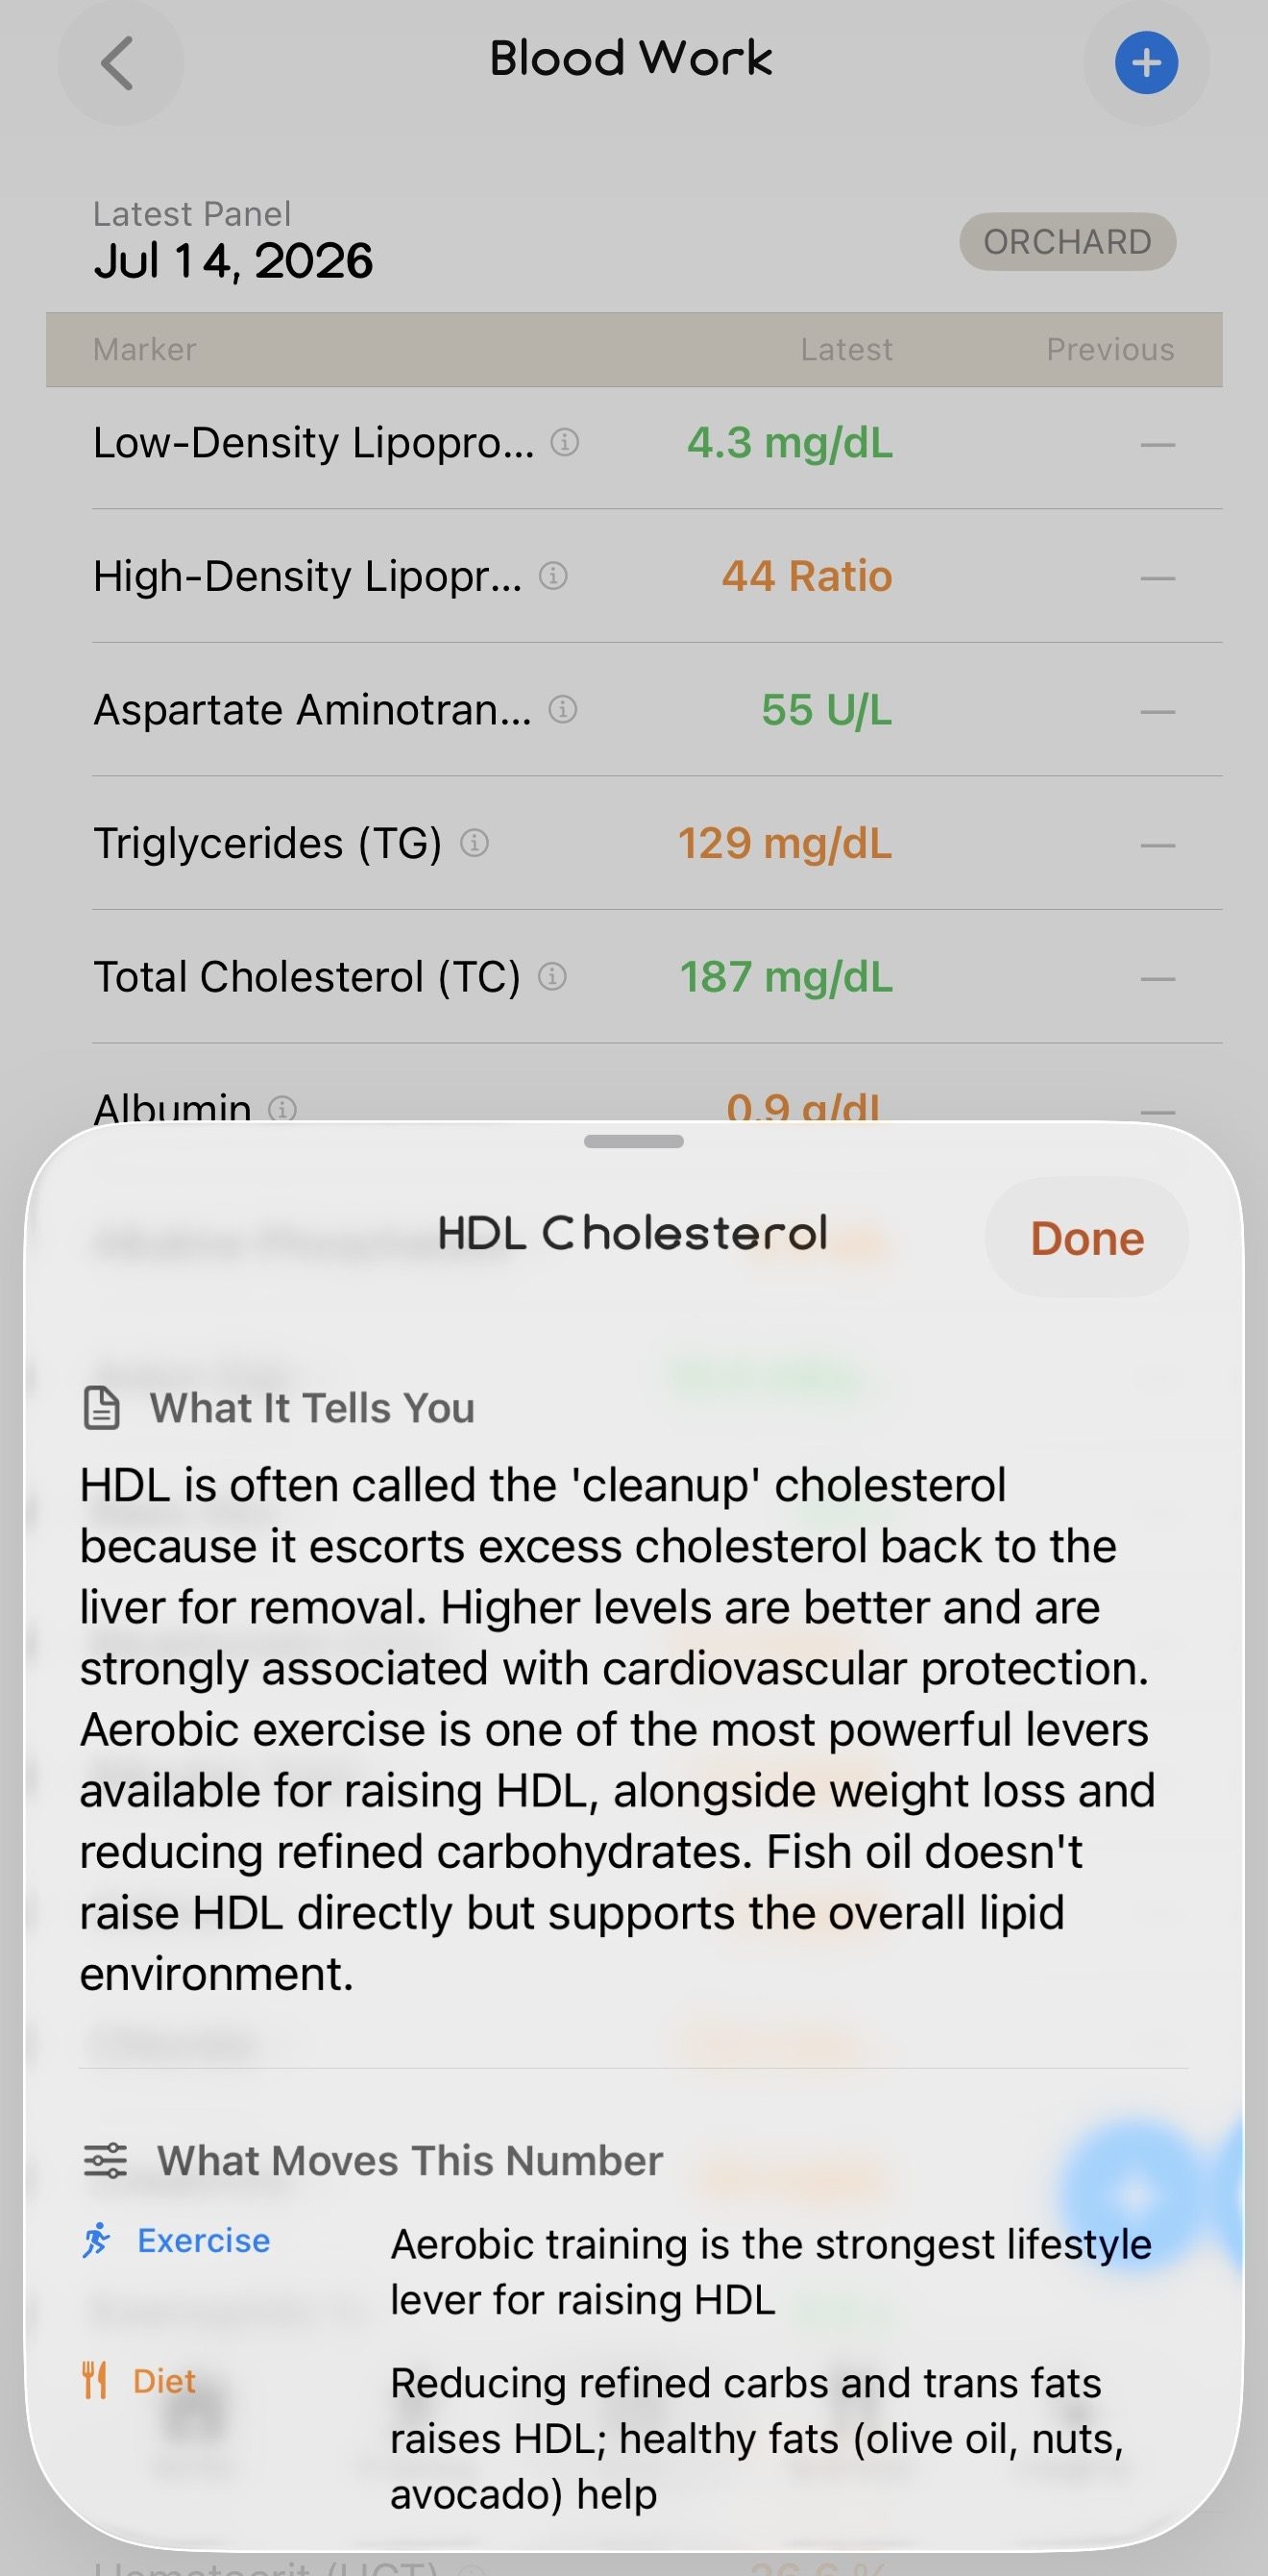
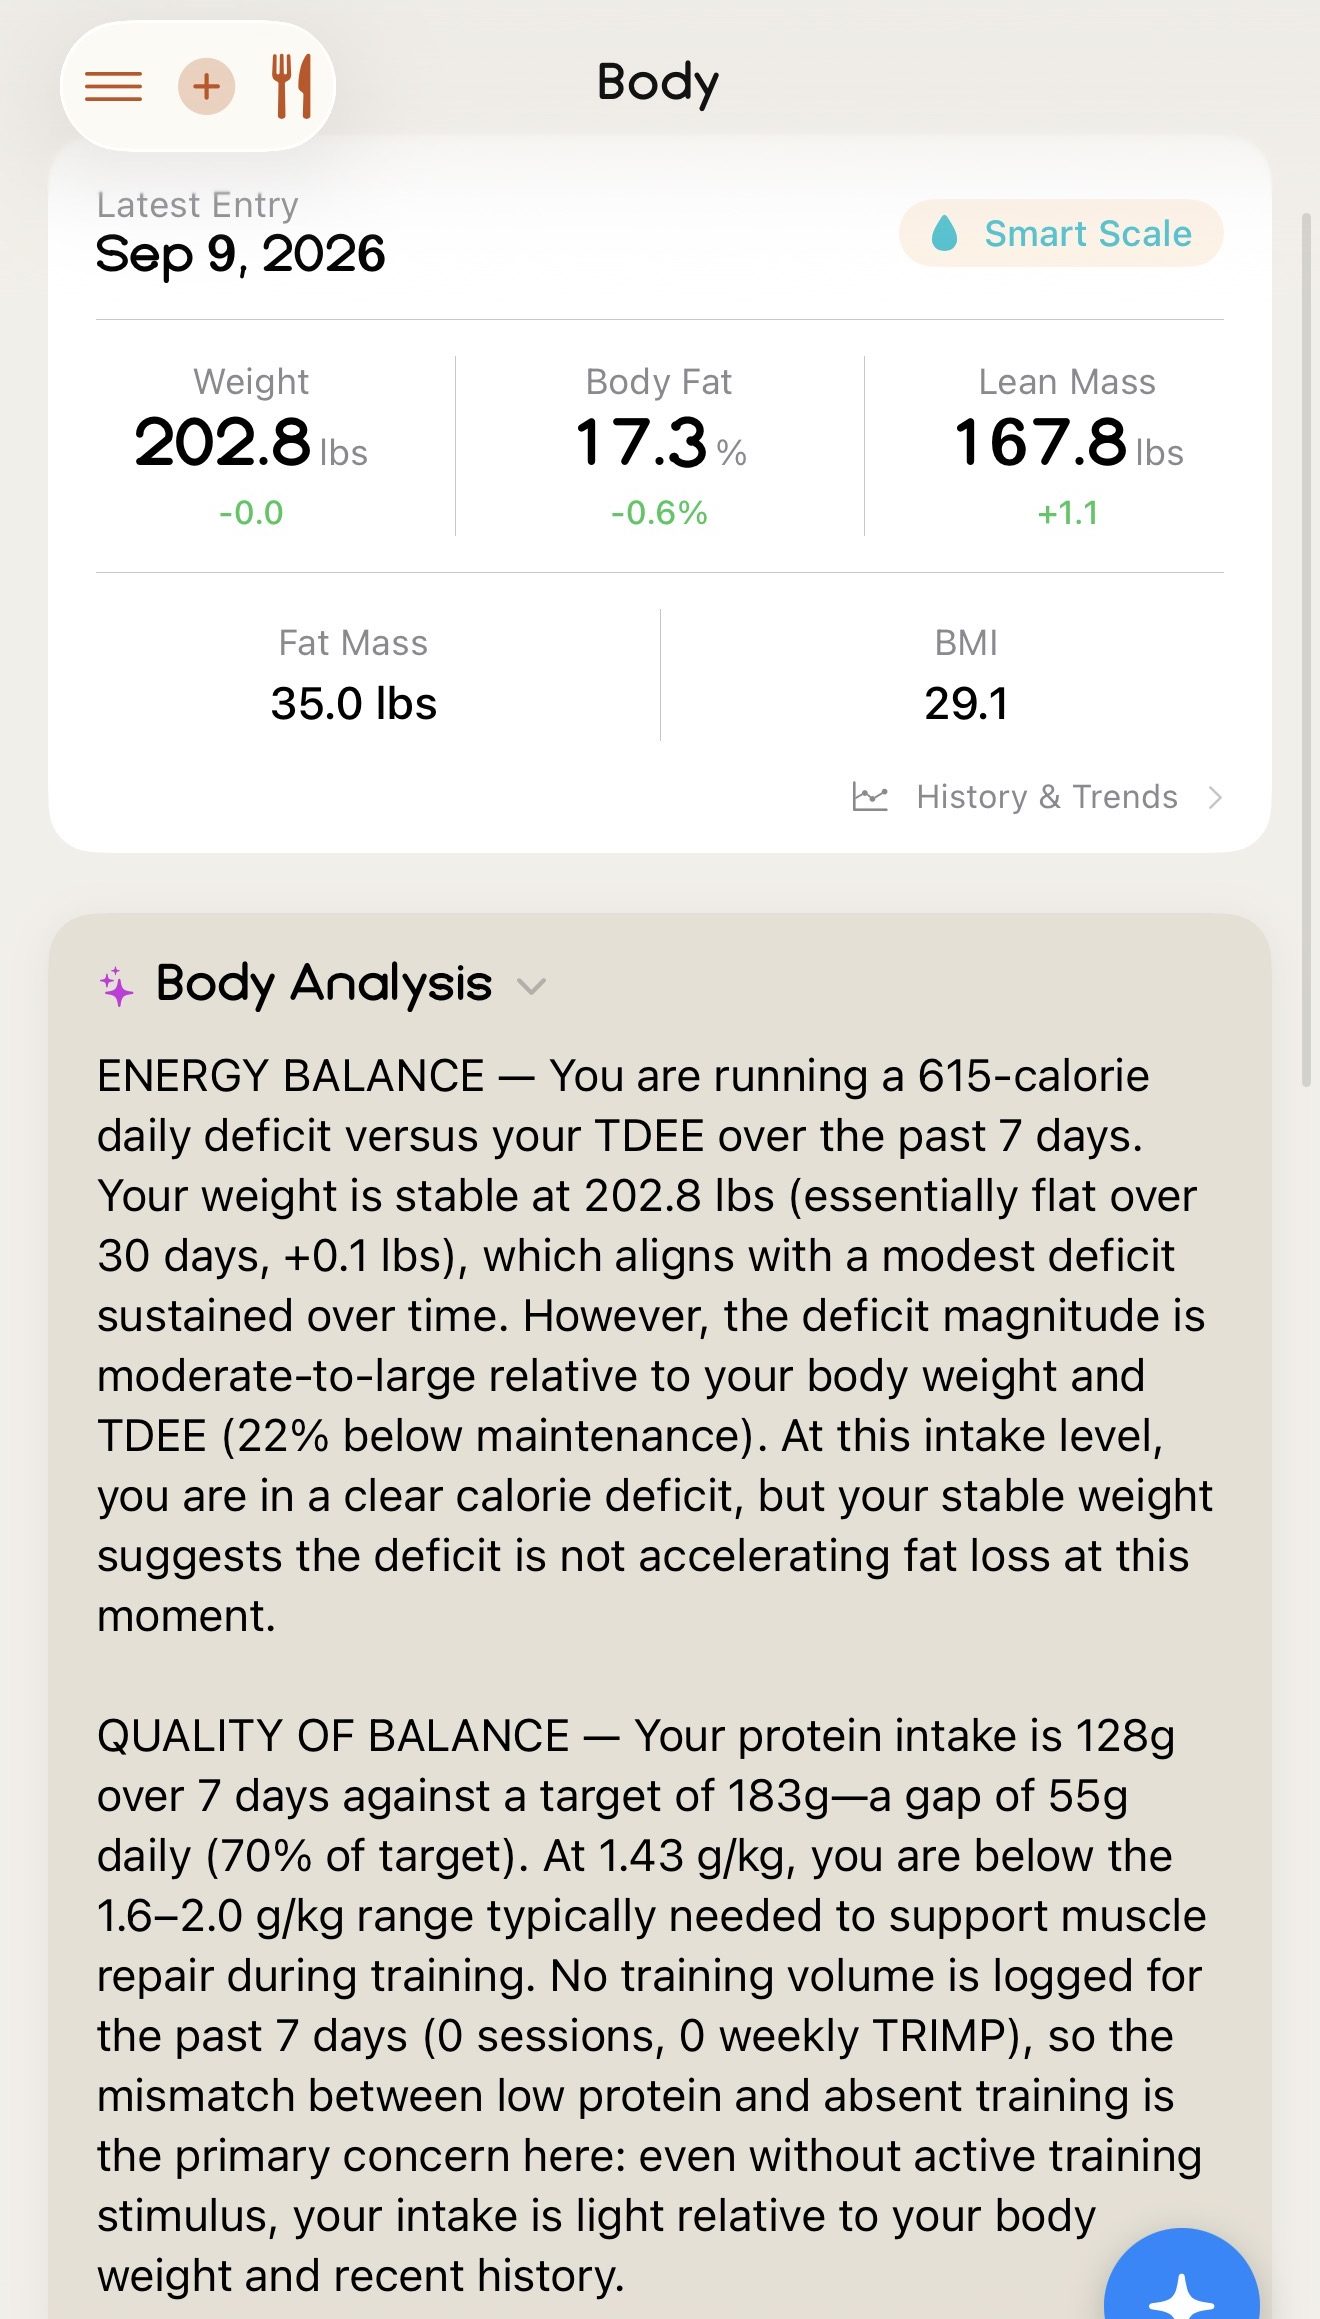
Every marker opens into what it actually tells you and the levers that move it, in the same language as your training. Body composition is scored against reference ranges for your age, not a single universal cutoff.
How it's built
A model that admits what it doesn't know.
Most biological age numbers show a single figure to one decimal place no matter how much data sits behind it. That is false precision. Enva does the opposite.
01
Score each domain
Every domain produces its own age estimate from its own signals, benchmarked against population norms for your age and sex. A domain with no data produces nothing, not a guess.
02
Reweight to what is present
Weights renormalize across the domains that actually reported. If you have never uploaded labs, the remaining four are rescaled to sum to one. You are never penalized for data you don't have yet.
03
Attach a confidence range
The fewer domains reporting, the wider the band around the estimate. Connect more sources and the range tightens. The number never claims a precision the inputs cannot support.
| Confidence | Domains reporting | Range shown | What it means |
|---|---|---|---|
| High | 4 or 5 | Point estimate | Enough coverage to state a single figure. |
| Medium | 2 to 3 | ± 1.5 years | Directionally sound, but a gap is widening the band. |
| Low | 1 | ± 3.0 years | One domain is carrying the whole estimate. Treat it as a first read. |
| Insufficient | 0 | No estimate | Enva shows nothing rather than a number it cannot stand behind. |
What this is not
A functional model, not a lab test.
Not an epigenetic clock
Enva does not measure DNA methylation. This is a functional model built from physiology, training and blood chemistry: a different and more actionable thing, but not the same measurement.
Not a diagnosis
Nothing here is medical advice. A biomarker outside its reference range is a reason to talk to a clinician, not a conclusion.
Not a score to game
The domains are weighted by predictive value, not by how easy they are to move. Chasing the number by optimizing one input is how you end up with a better number and the same body.
Early Access
See where you actually stand.
Join the waitlist and be first in line when Enva launches.
Coming soon to iPhone.