Sleep & Recovery
Last night, and whether
you're ready today.
Your Sleep Score is built from what the night actually produced, scored against your own baseline. Recovery turns that into one read: what today's training should look like.
Coming soon to iPhone.
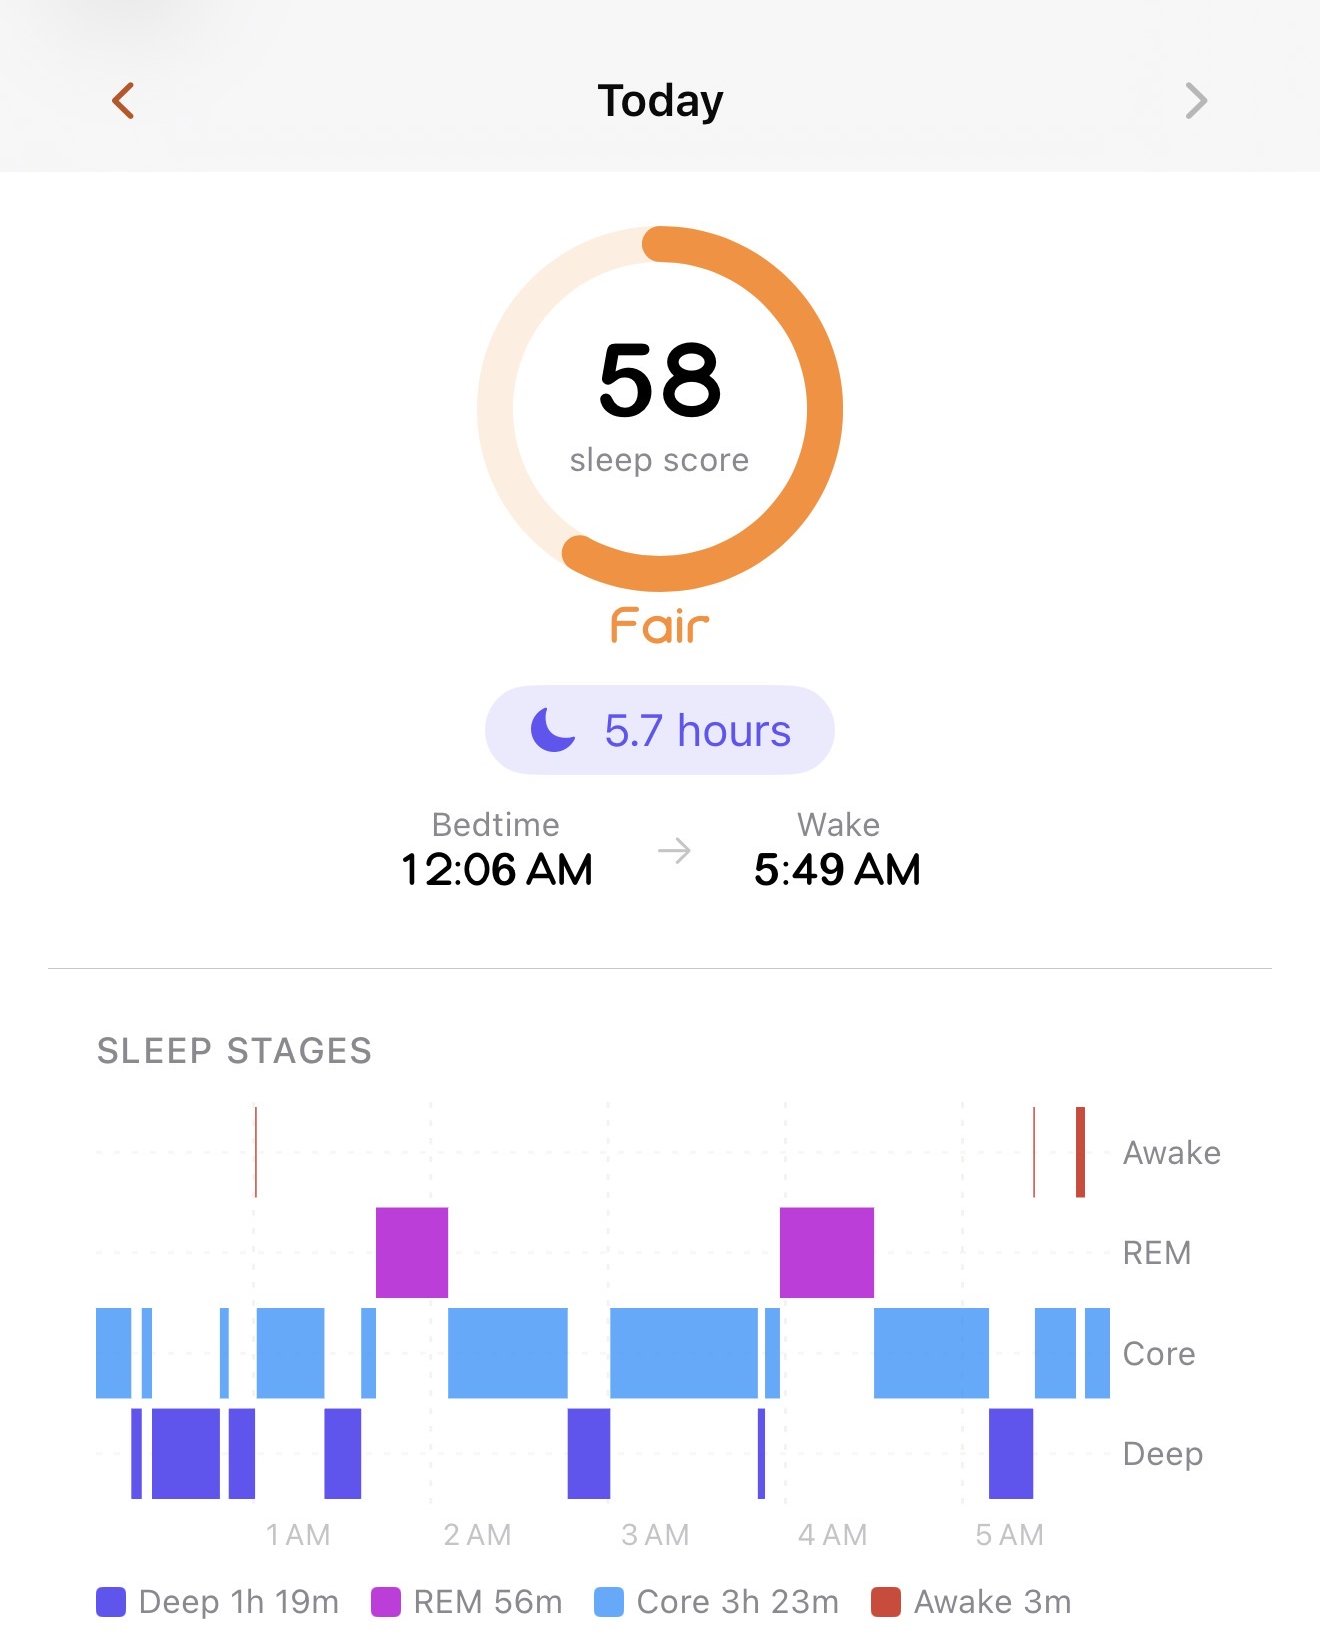
What the night produced
Scored against your baseline, not a population chart.
Someone whose deep sleep averages 45 minutes should not be scored against someone who averages 80. Enva learns your 30-day baseline for each signal and scores the night relative to it, with absolute duration still weighted so stage proportions alone cannot carry a short night.
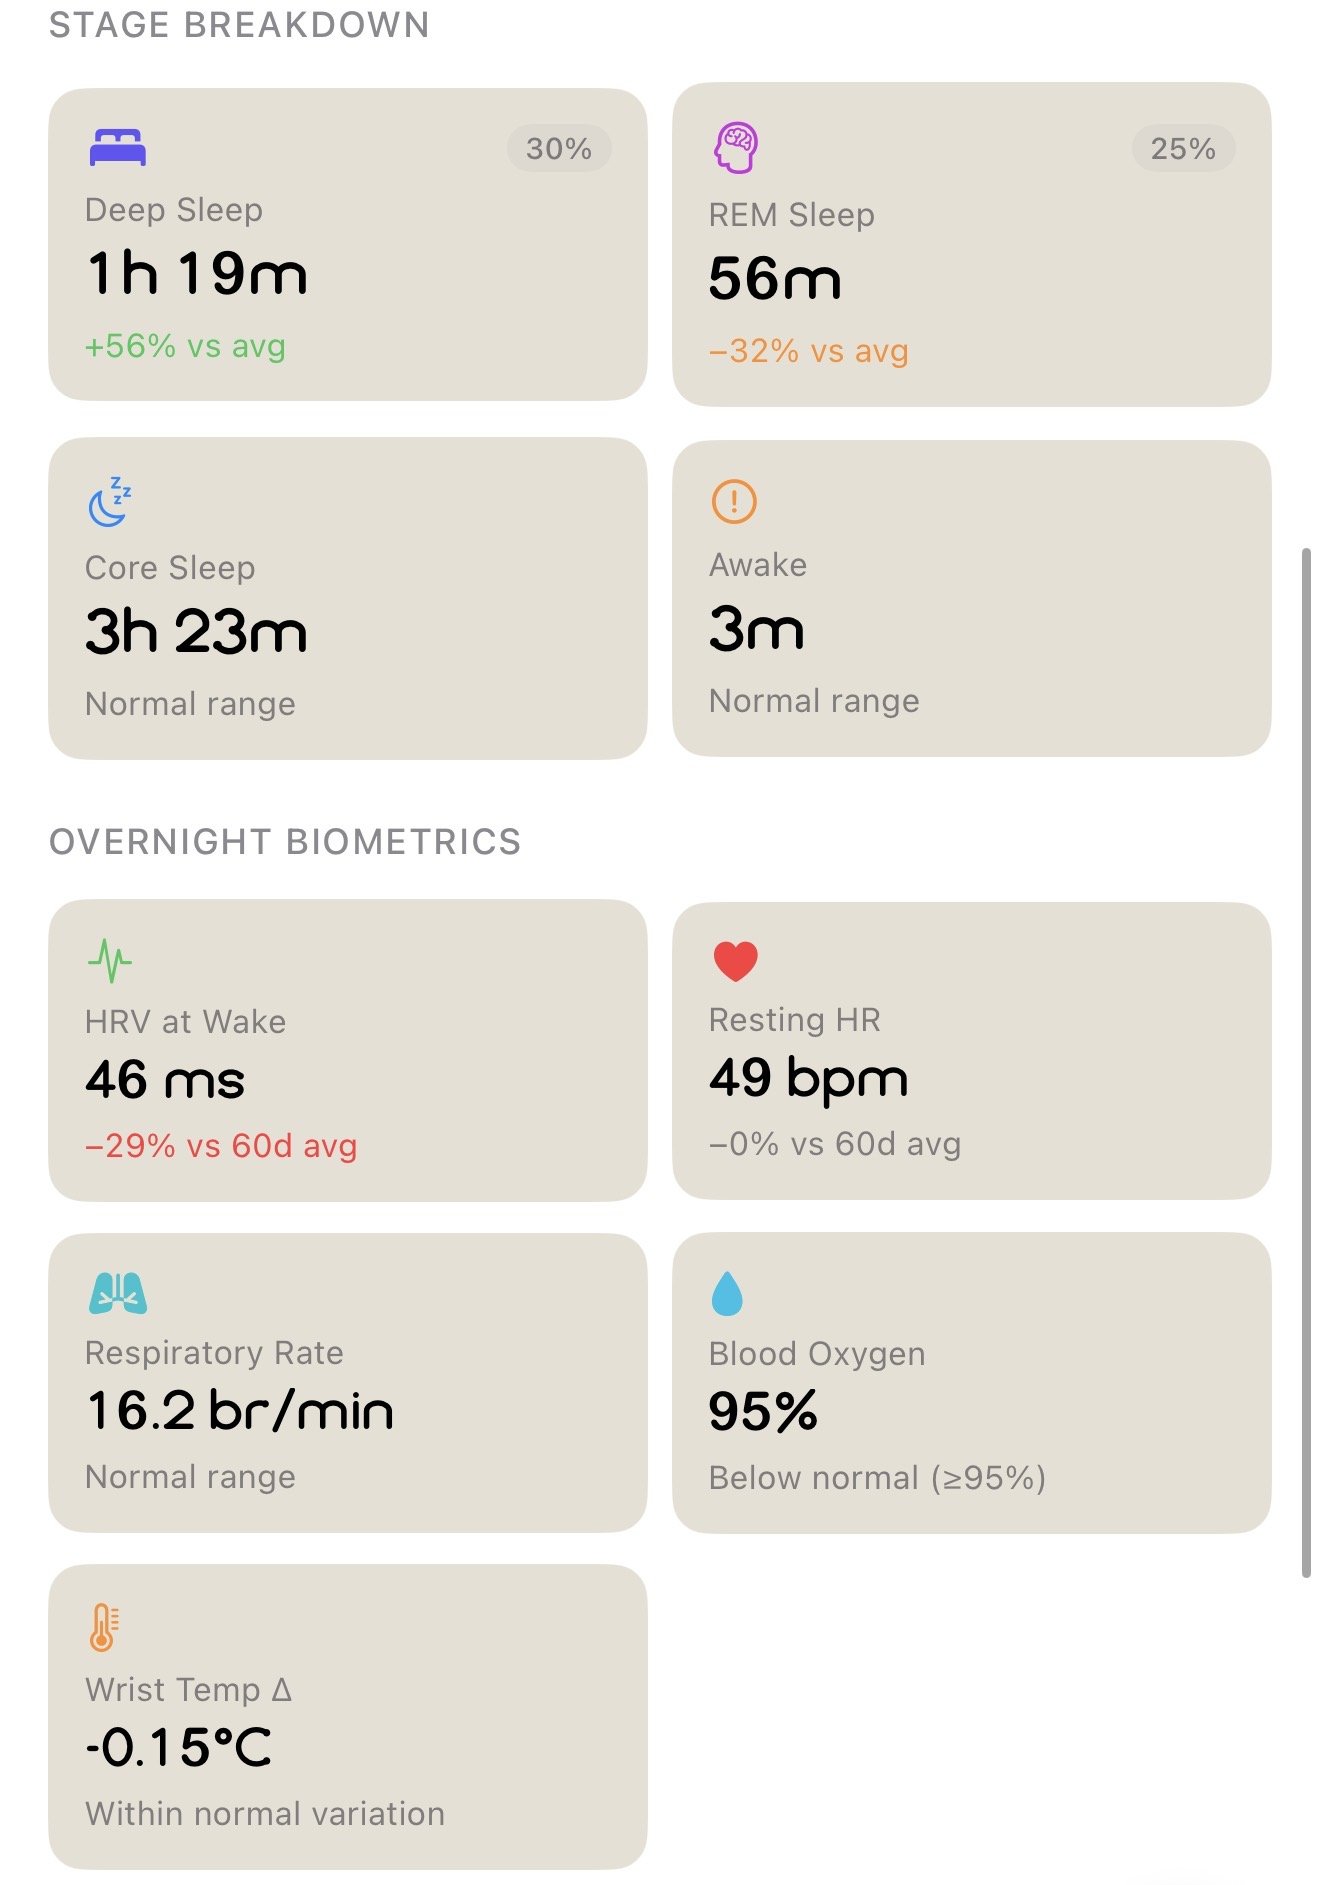
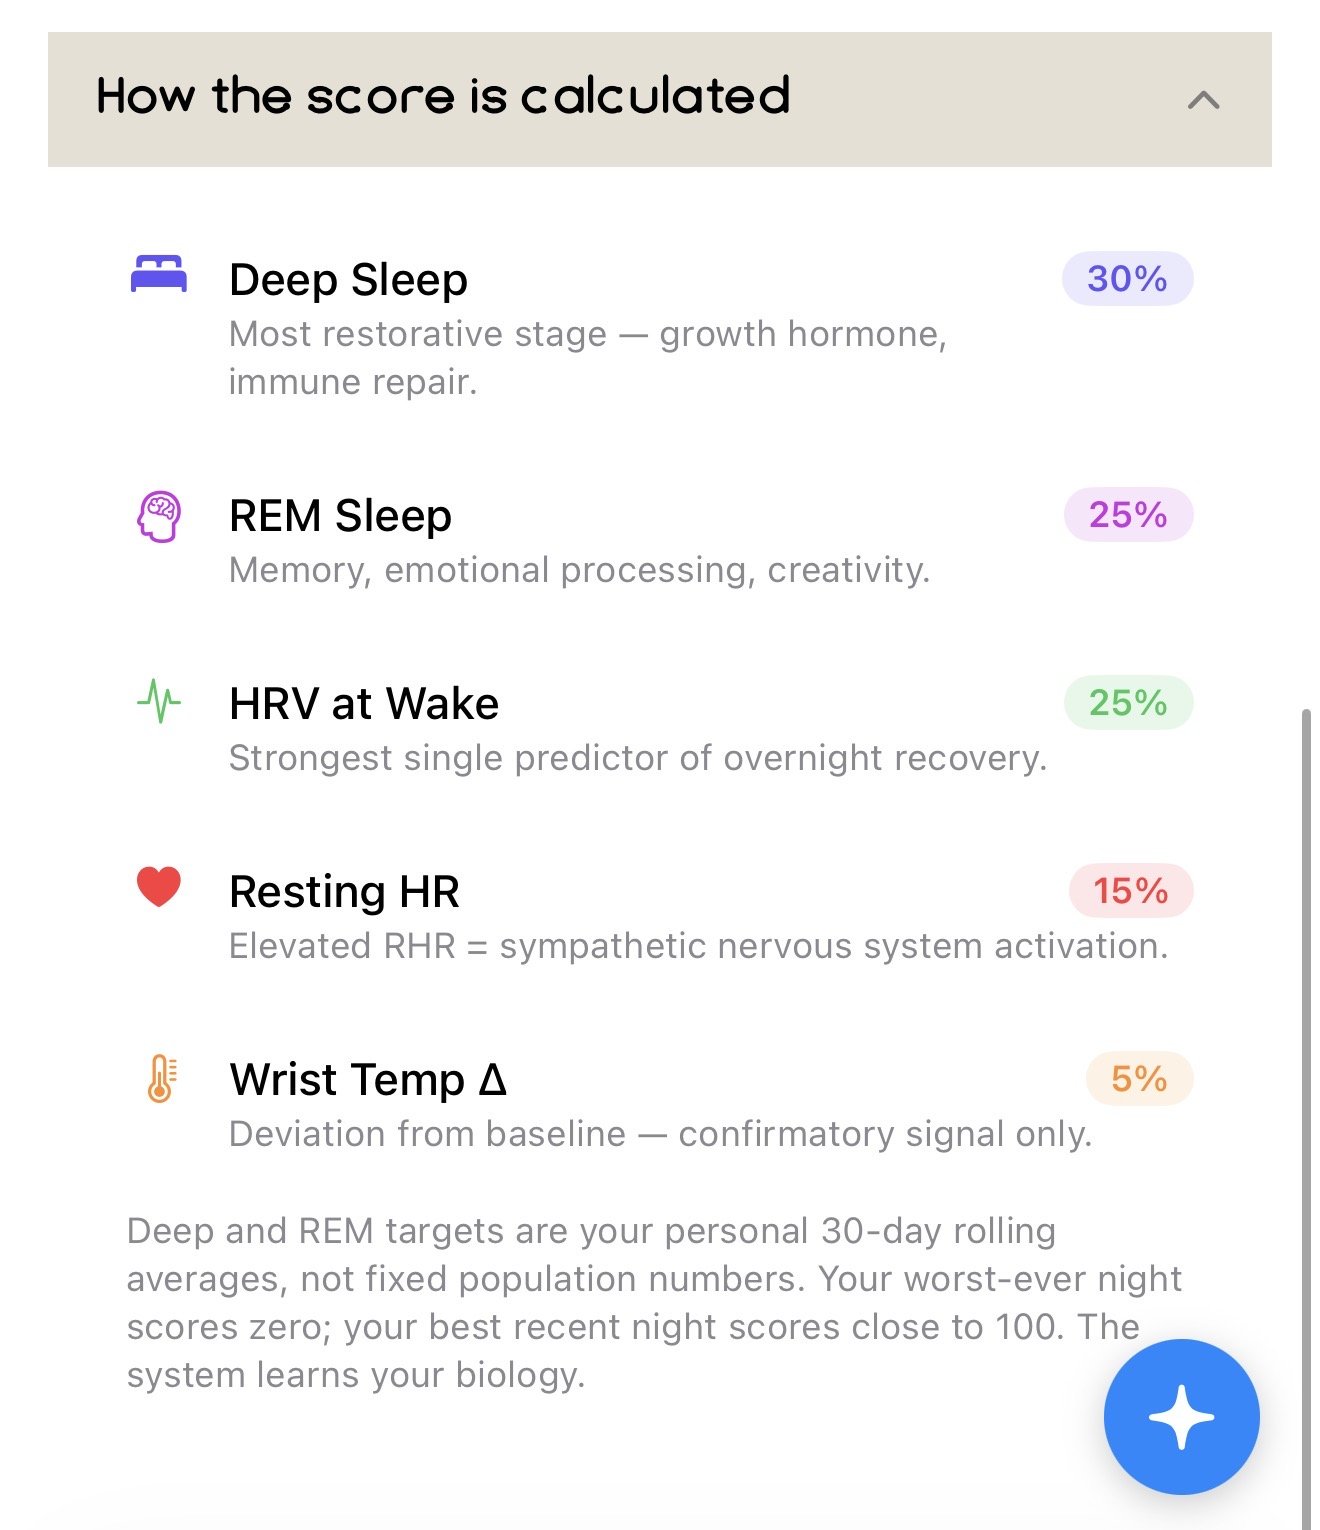
Deep sleep
30% of the score
The most restorative stage: growth hormone, immune repair. Scored against your own 30-day baseline, with a floor on absolute minutes.
REM sleep
25% of the score
Memory, emotional processing, creativity. Weighted alongside deep sleep rather than lumped into a single "quality" figure.
HRV at wake
25% of the score
The strongest single predictor of overnight recovery. Enva uses the full sleep-period average, not a pre-wake spike, so the number matches how you feel instead of flattering it.
Resting heart rate
15% of the score
The overnight low against your baseline. A sustained rise is one of the earliest signs of accumulated stress or illness.
Wrist temperature
5% of the score
Confirmatory. A deviation from baseline flags physiological stress and suppresses the rest-day boost, regardless of what the sleep stages show.
Respiratory rate and blood oxygen are shown alongside the score as context. Deep and REM targets are your personal 30-day rolling averages, so the model learns your biology rather than grading you against a stranger's.
The trend, and the debt
One night is noise. Fourteen is a pattern.
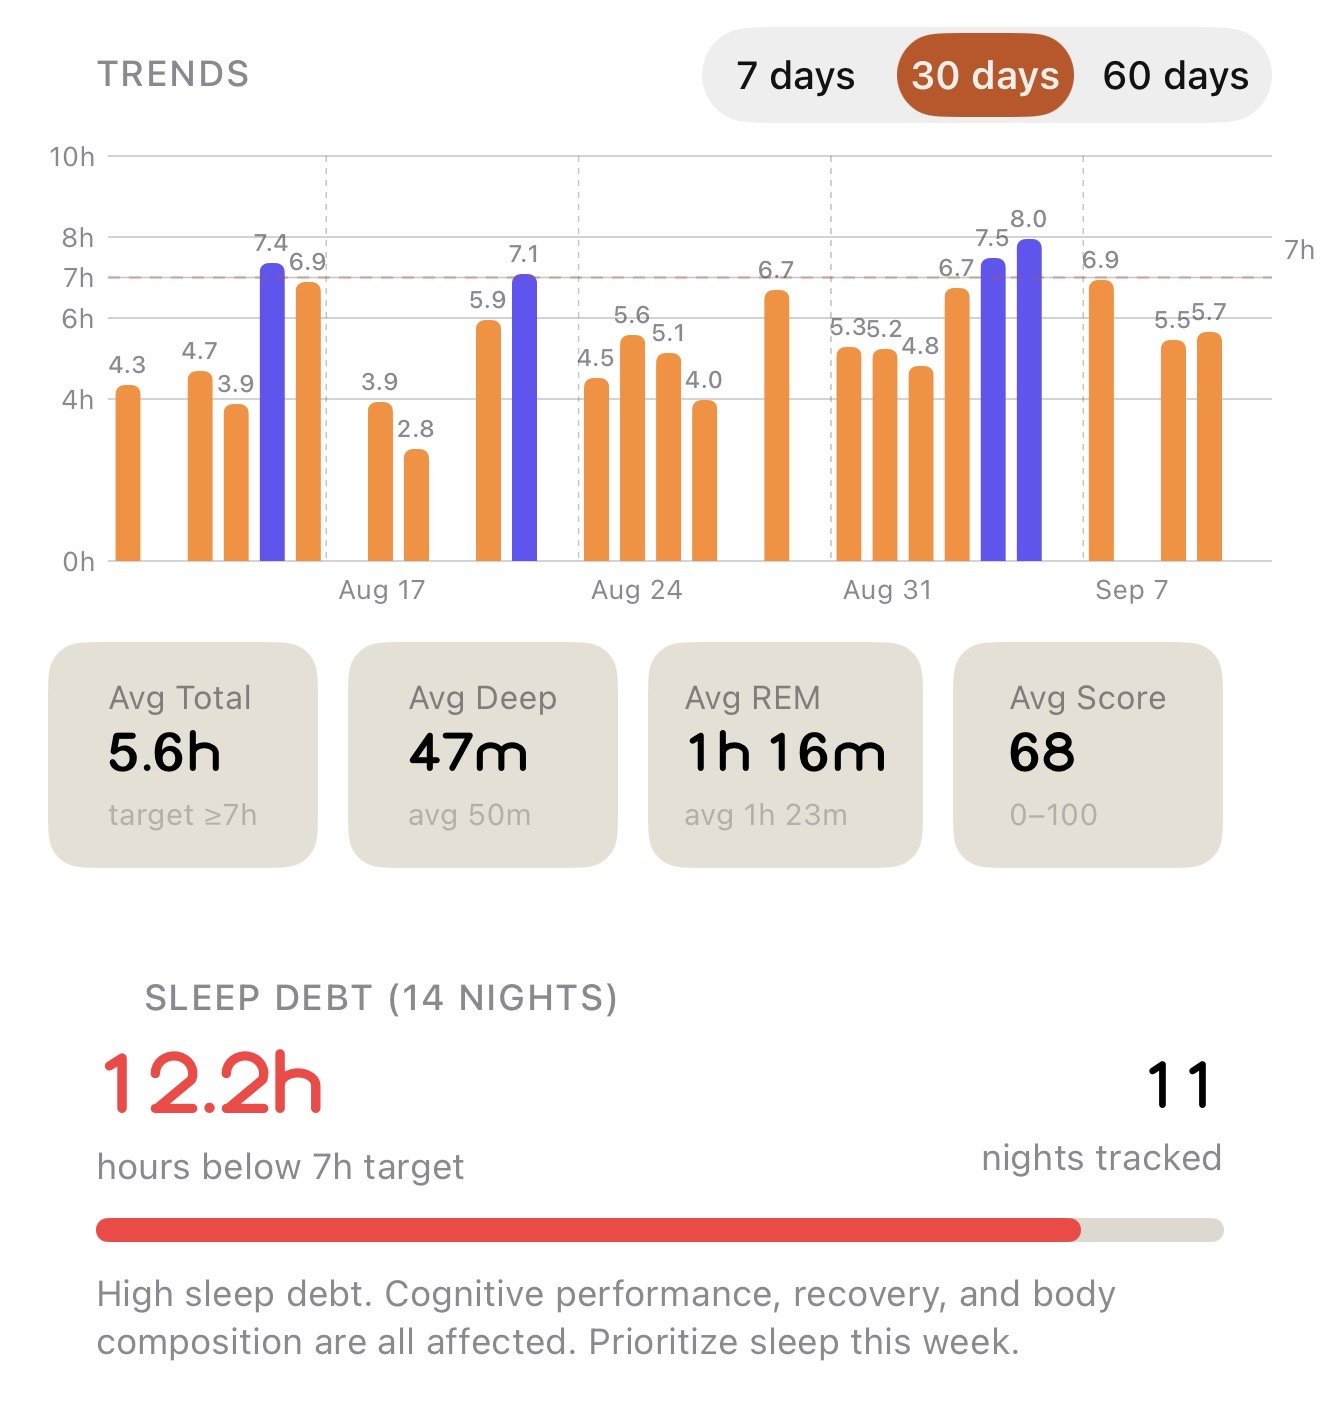
The trend view holds your nightly hours, deep, REM and score against their targets over 7, 30 or 60 days, so a run of short nights is impossible to miss.
Underneath it, a running tally: how many hours you sit below your target across the last two weeks. High sleep debt shows up in cognitive performance, recovery and body composition, and the number says so plainly.
Sleep feeds Recovery
The night becomes a read on the day.
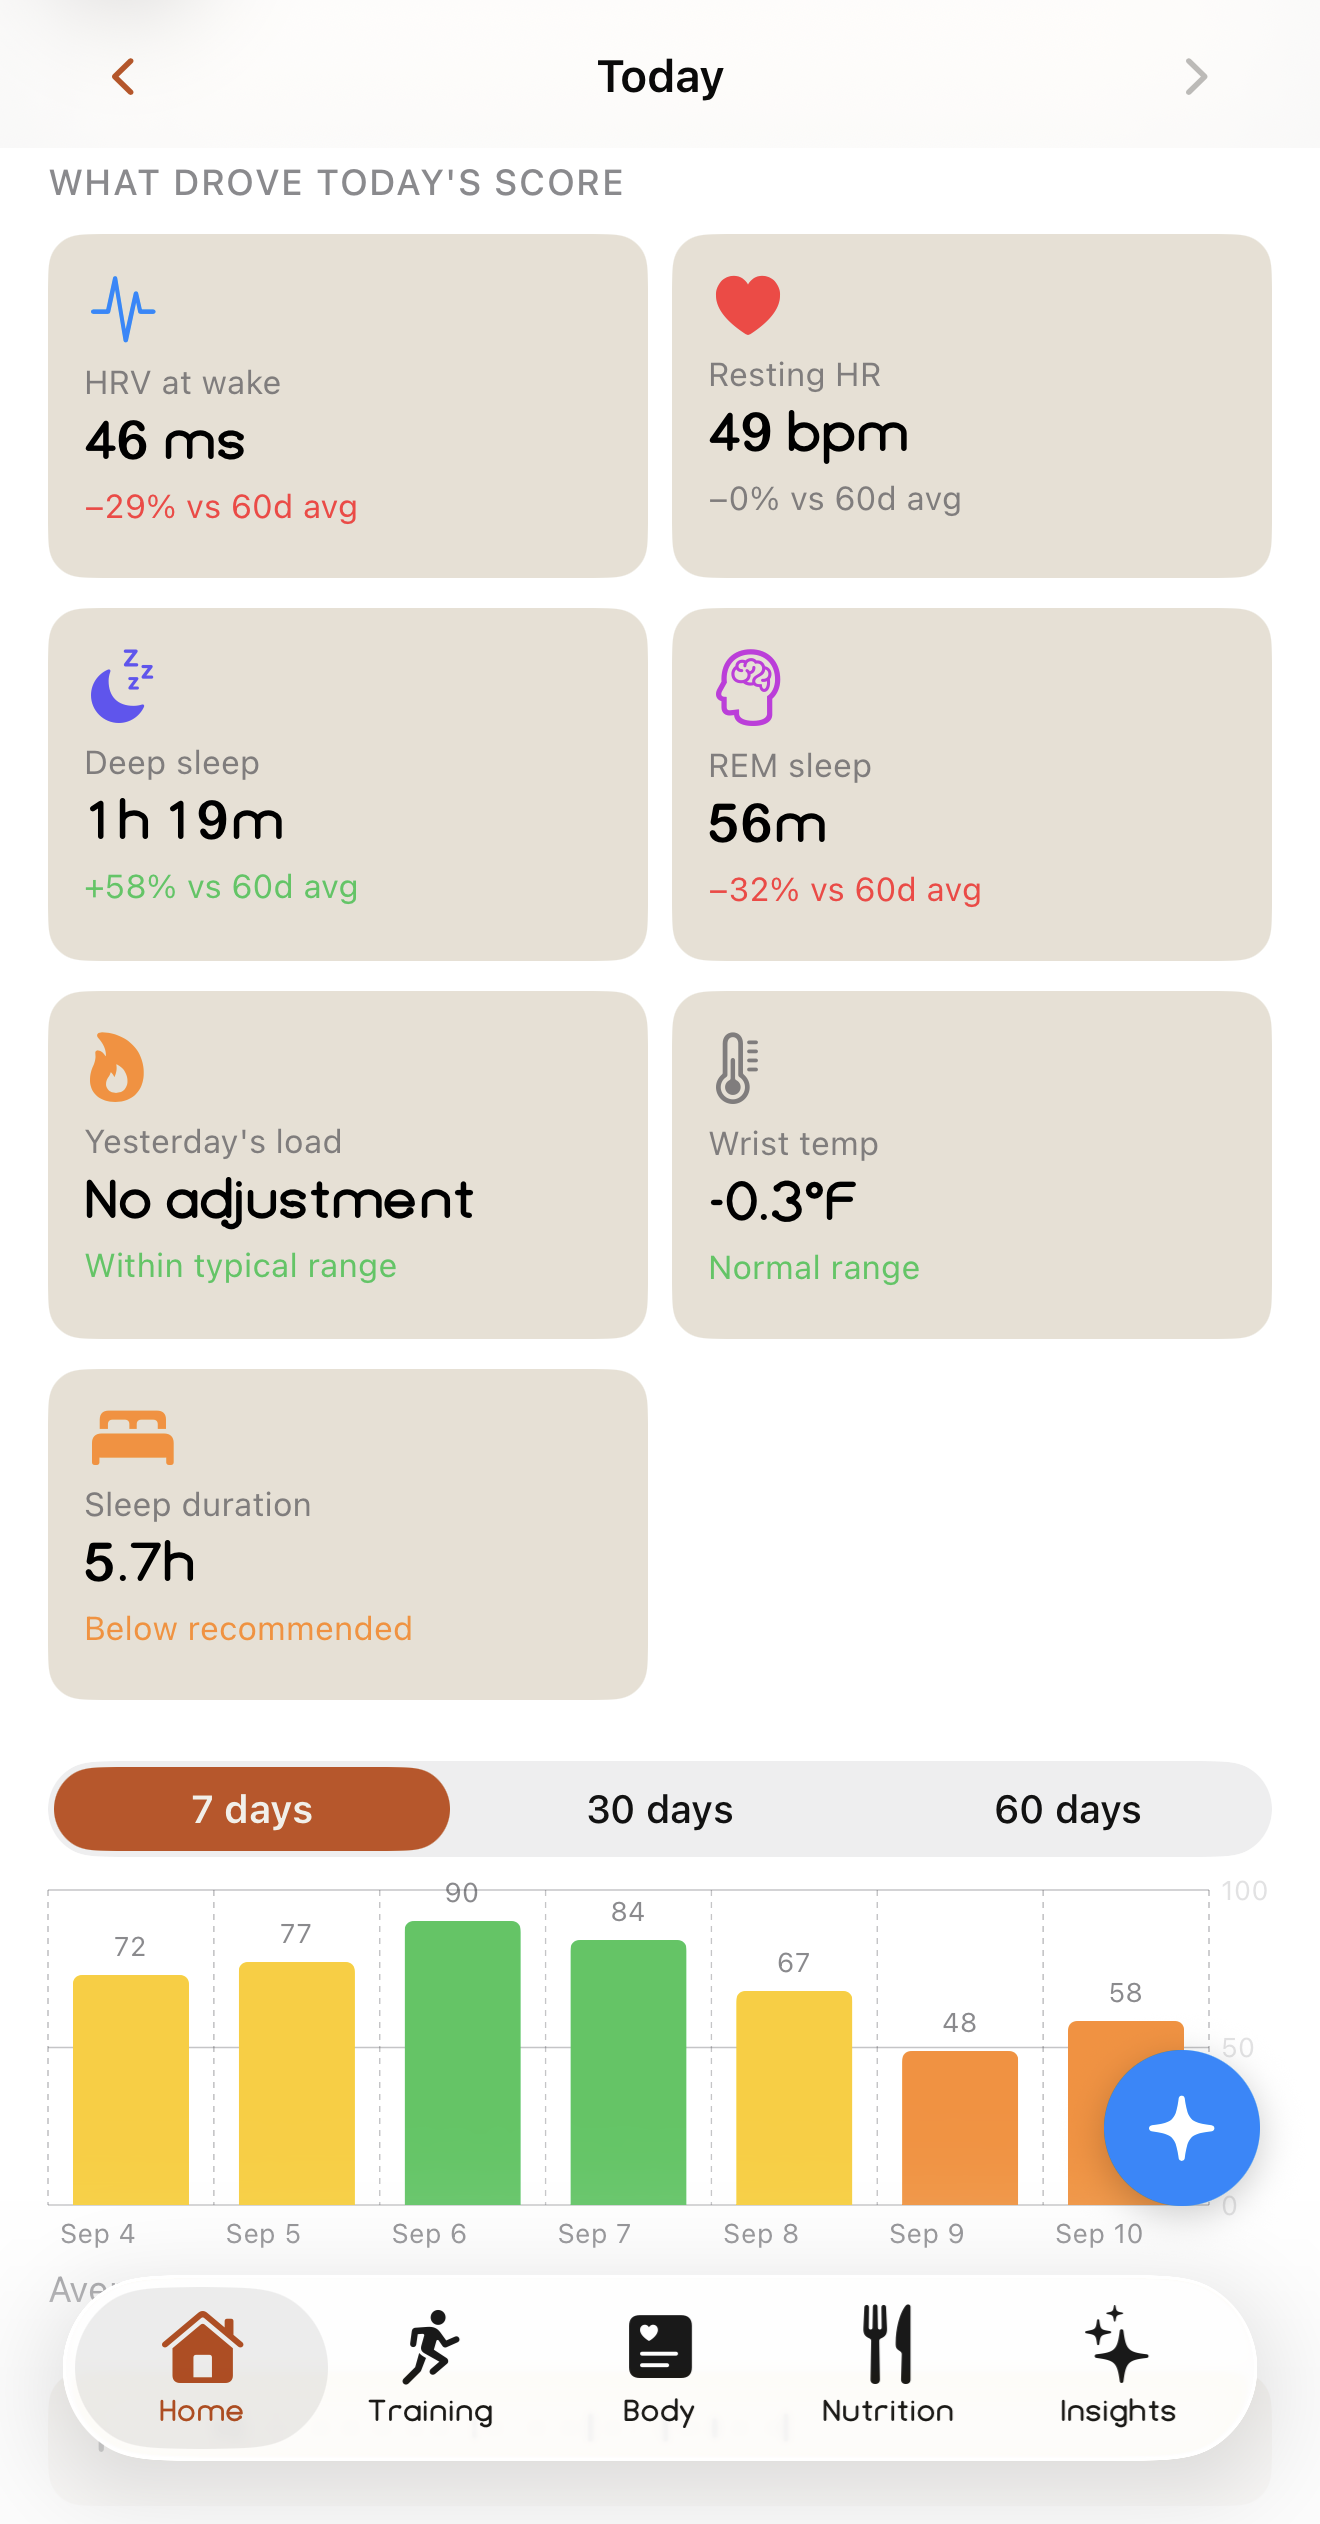
Recovery takes the same overnight signals and answers a different question: is your body in a position to absorb today's work?
Each card shows the signal against its baseline, so you can see exactly what moved the number, and a 7-day view shows whether it's an off night or a trend.
A low Recovery score is not a warning.
High Recovery on a rest day is exactly right. Low Recovery after a hard block means the training is doing its job. Today's effort should match what the body can currently handle.
Yesterday's load above your 30-day average lowers the score; a genuine rest day adds a boost; if wrist temperature signals stress, that boost is suppressed. A rest day and a sick day should not look the same.
Recovery turns into a concrete plan on the Recovery Actions page.
Where it connects
The output that sets today's plan.
Health Score
A rolling 7-day average of Recovery is the Readiness pillar, 40 percent of the weekly number. One bad night doesn't crater it; a run of them shows up exactly as it should.
Nutrition
Late meals, alcohol and low carbohydrate availability register here first, the morning after.
Biological Age
Heart-rate recovery and sleep architecture feed the Recovery Capacity domain of the long-term model.
Recovery Actions
Caffeine timing, wind-down and a steady wake time are the levers that move tomorrow's score.
See how the pillars are weighted on the How It Works page.
Early Access
Know what today should look like.
Join the waitlist and be first in line when Enva launches.
Coming soon to iPhone.