Enva Health Score
Forty signals.
One number.
Apple Health shows your resting heart rate, HRV, sleep and VO₂ Max each on its own. The Enva Health Score reads them together and gives you one number for how this week is actually going.
Coming soon to iPhone.
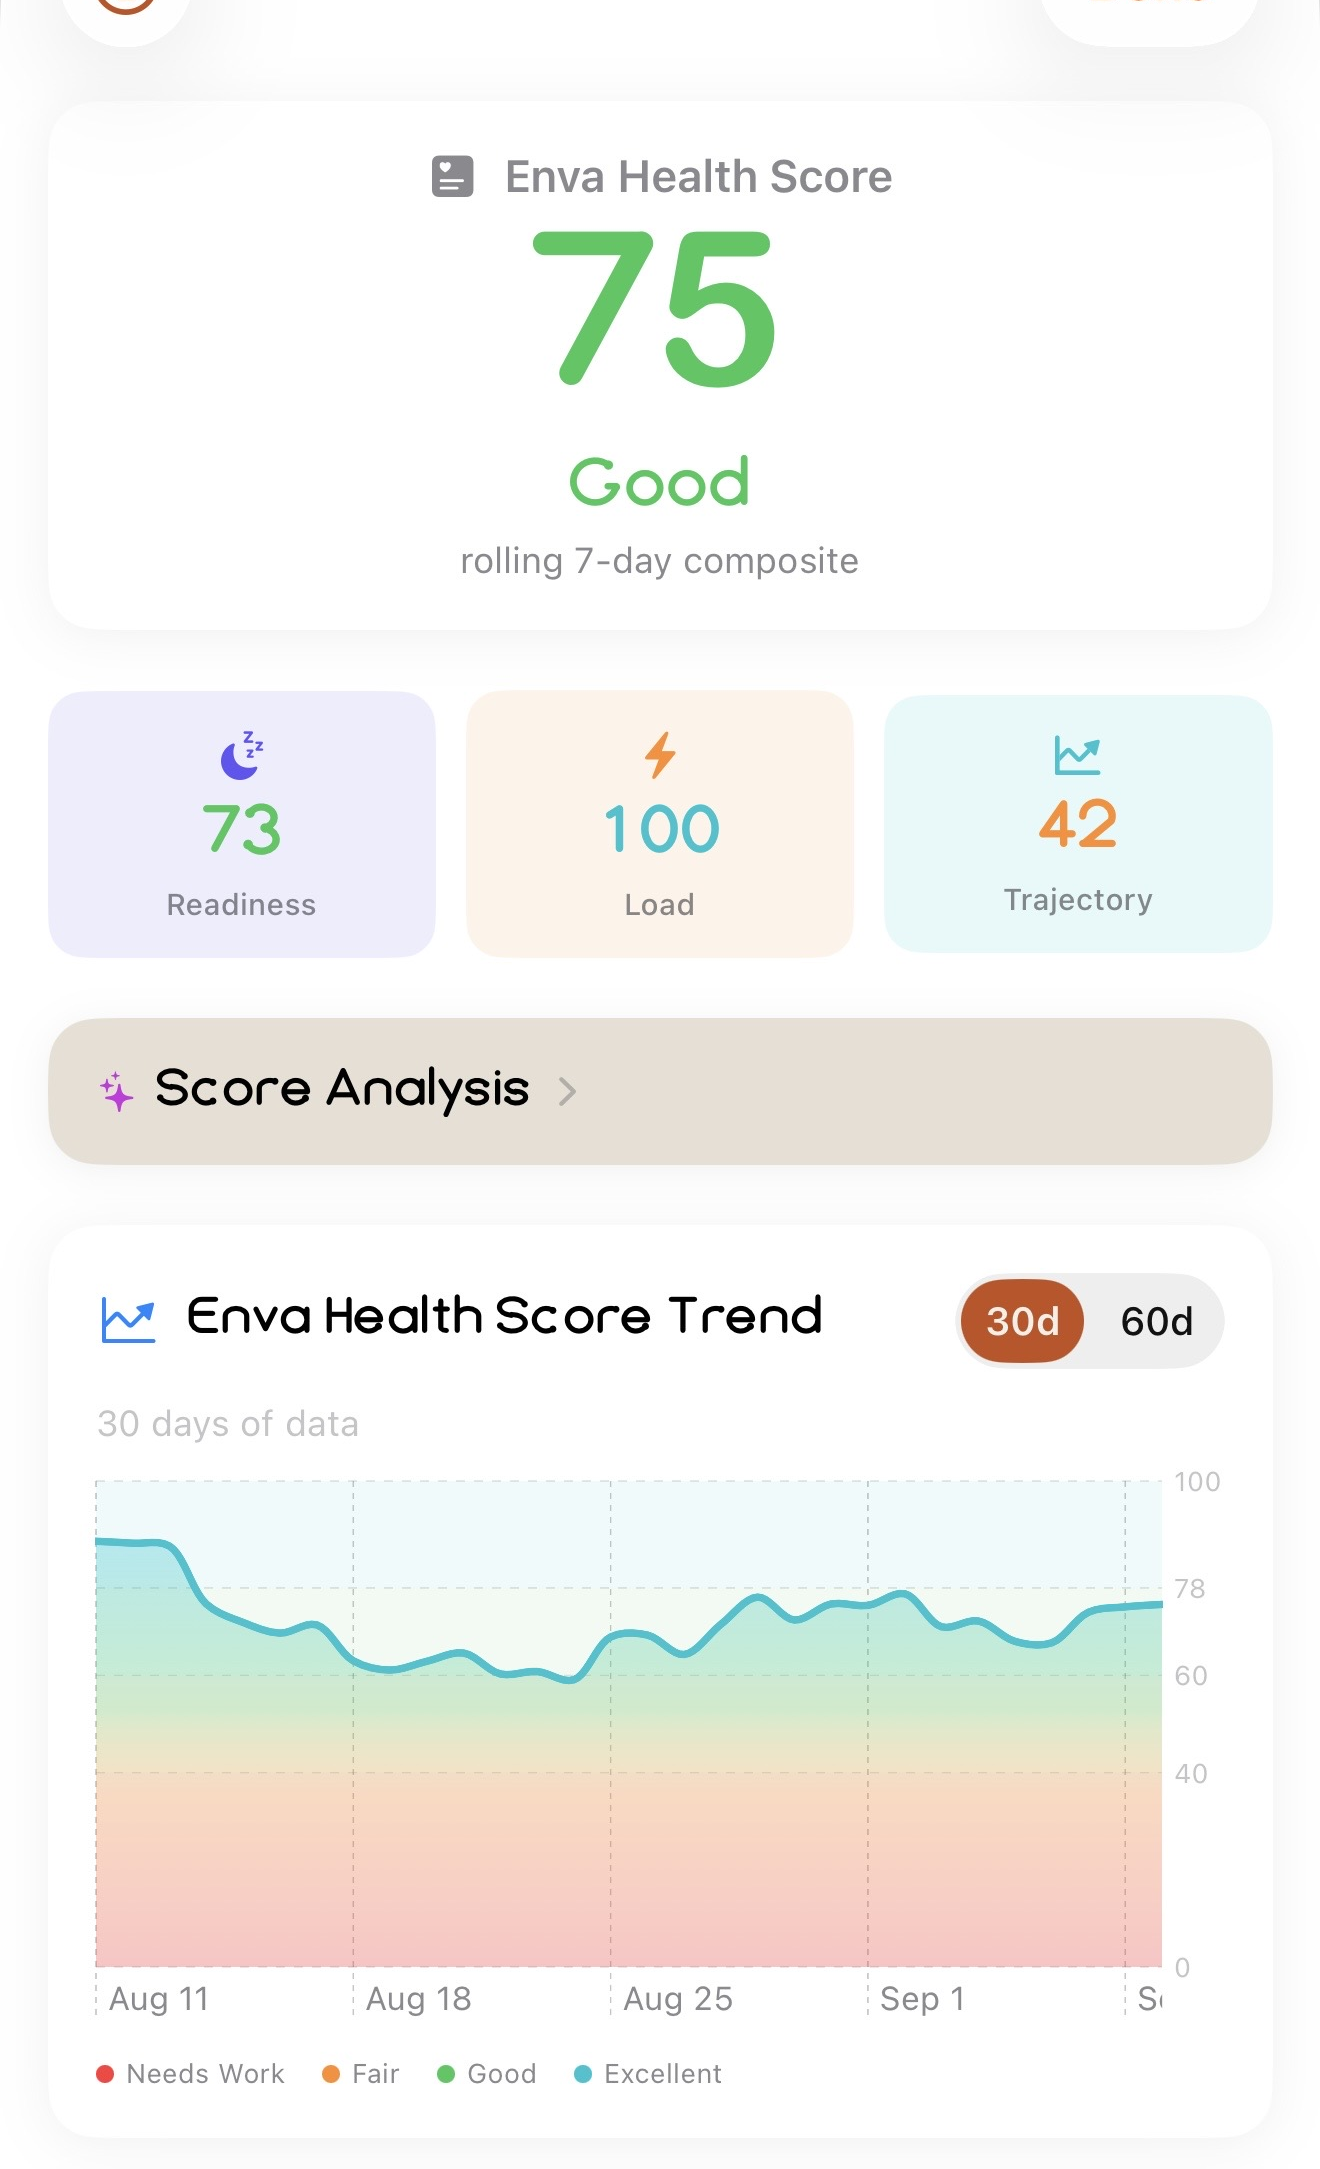
What goes into it
Three pillars, each measured against your own baseline.
Not just recovered. Not just active. Trained well, recovering well, and heading the right way, weighted into one number and scored against you, not a population chart.
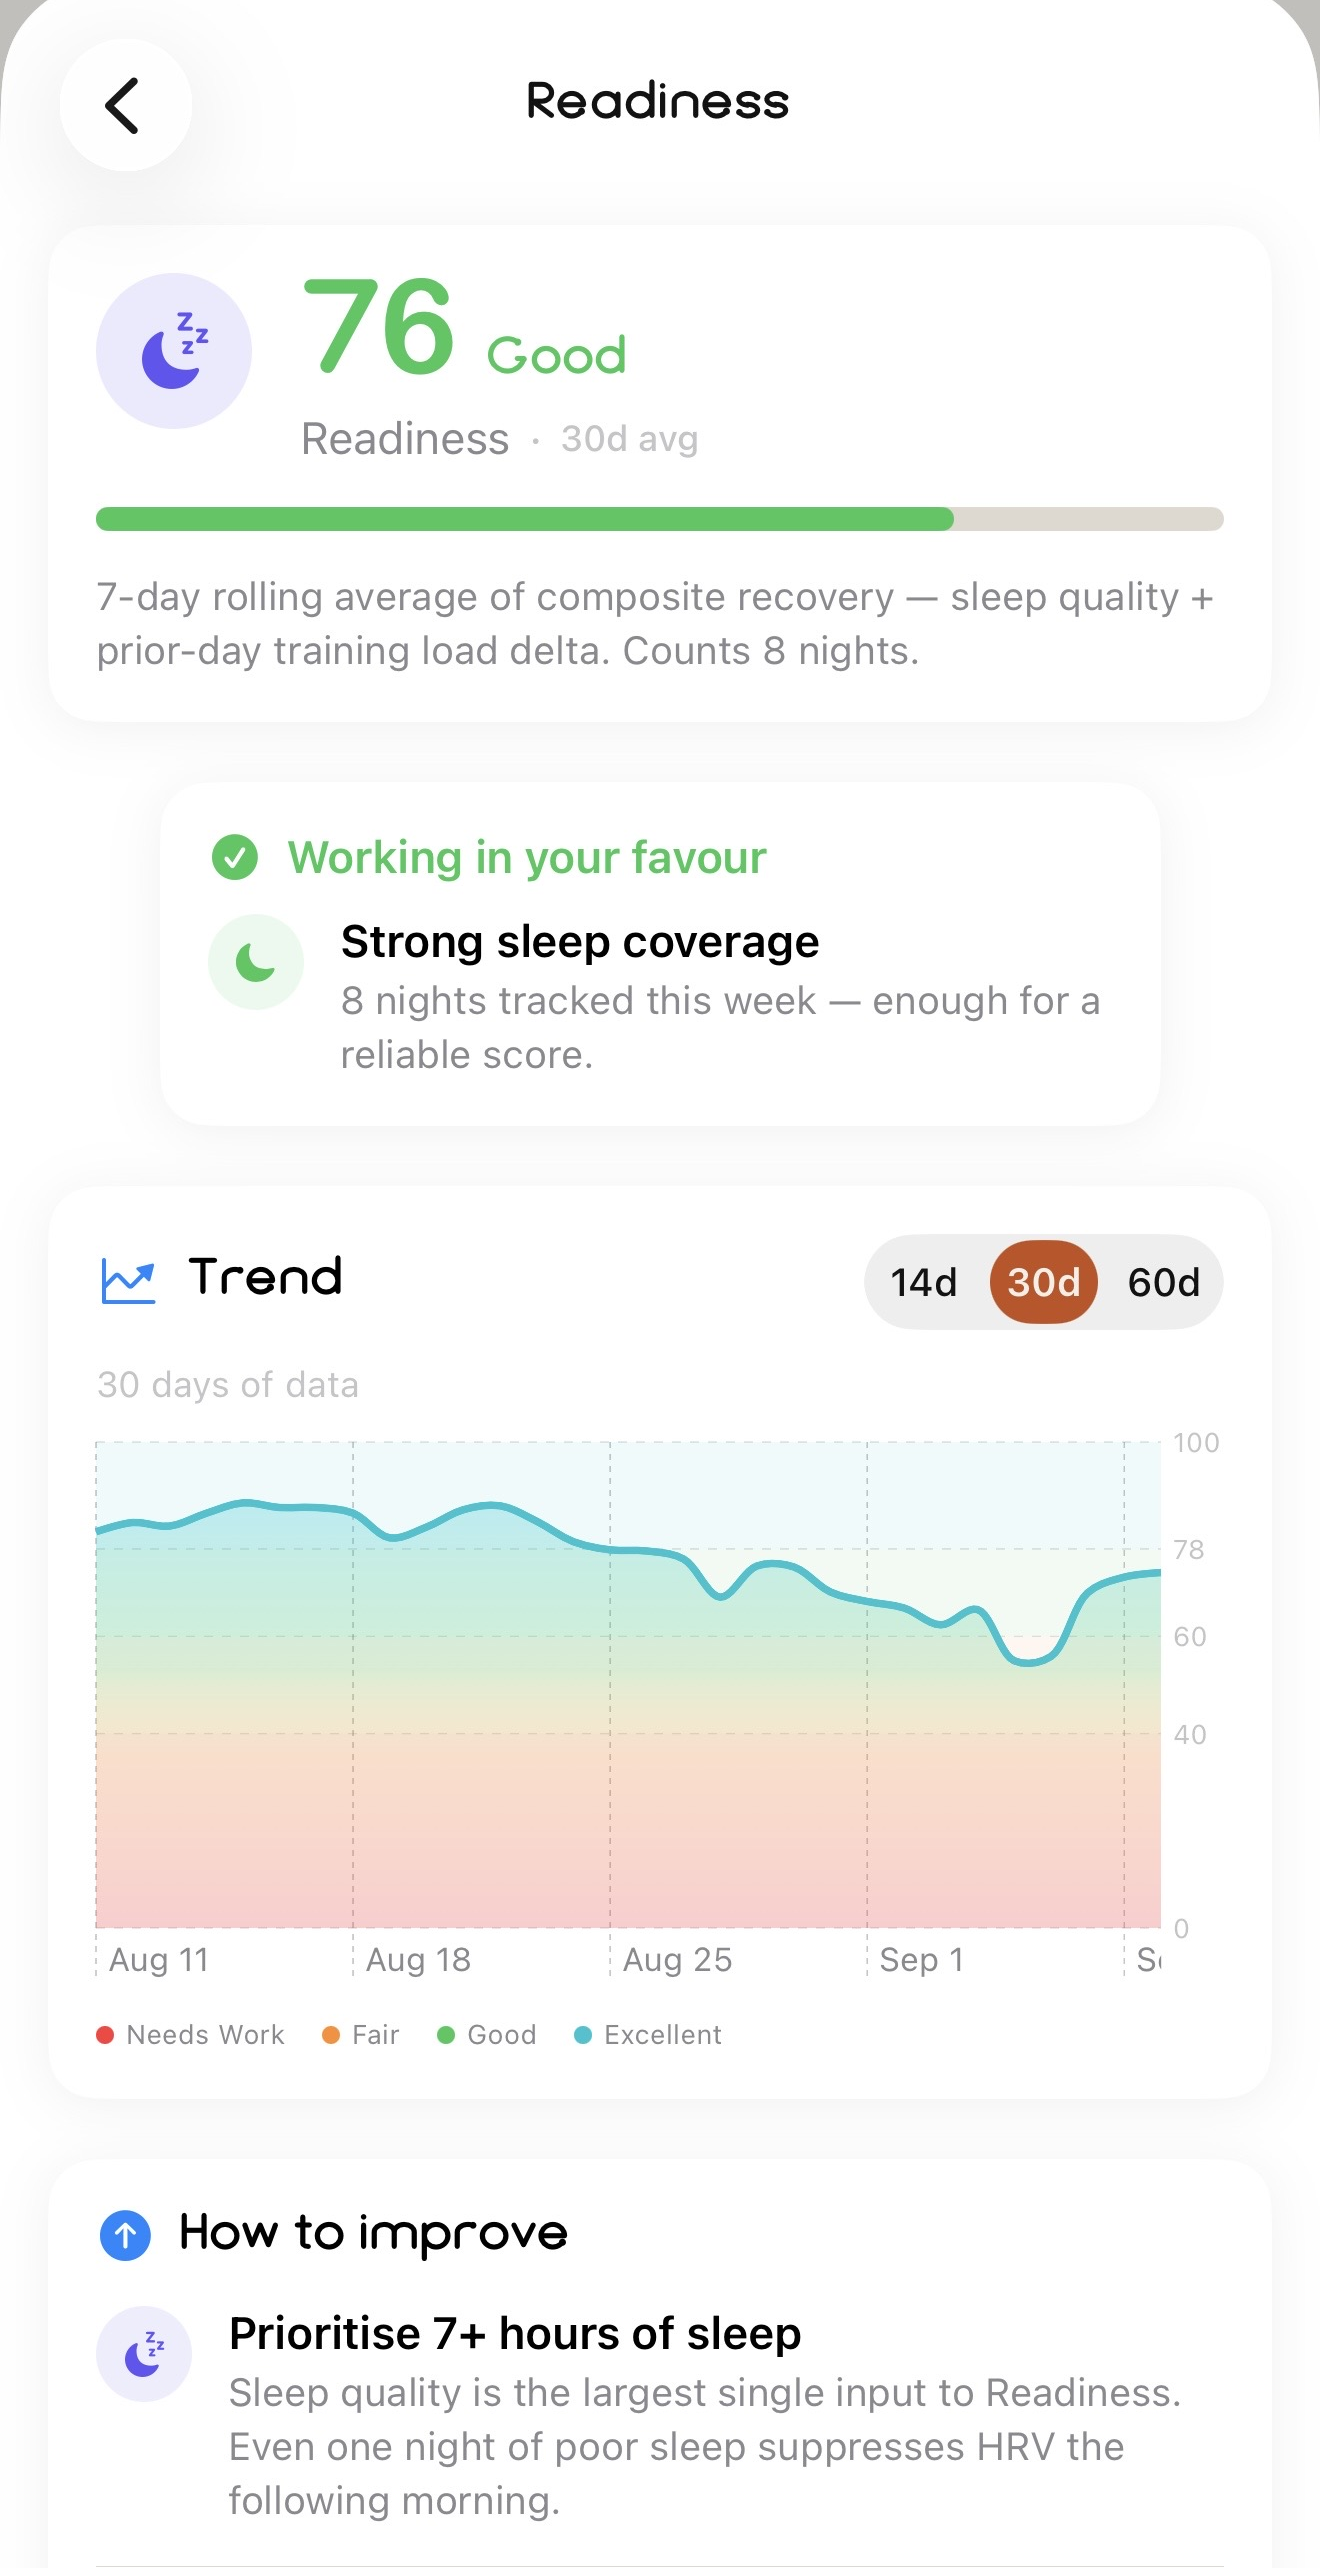
Readiness · 40%
How recovered you are
A 7-day rolling average of composite recovery, weighted by sleep quality and prior-day training load.
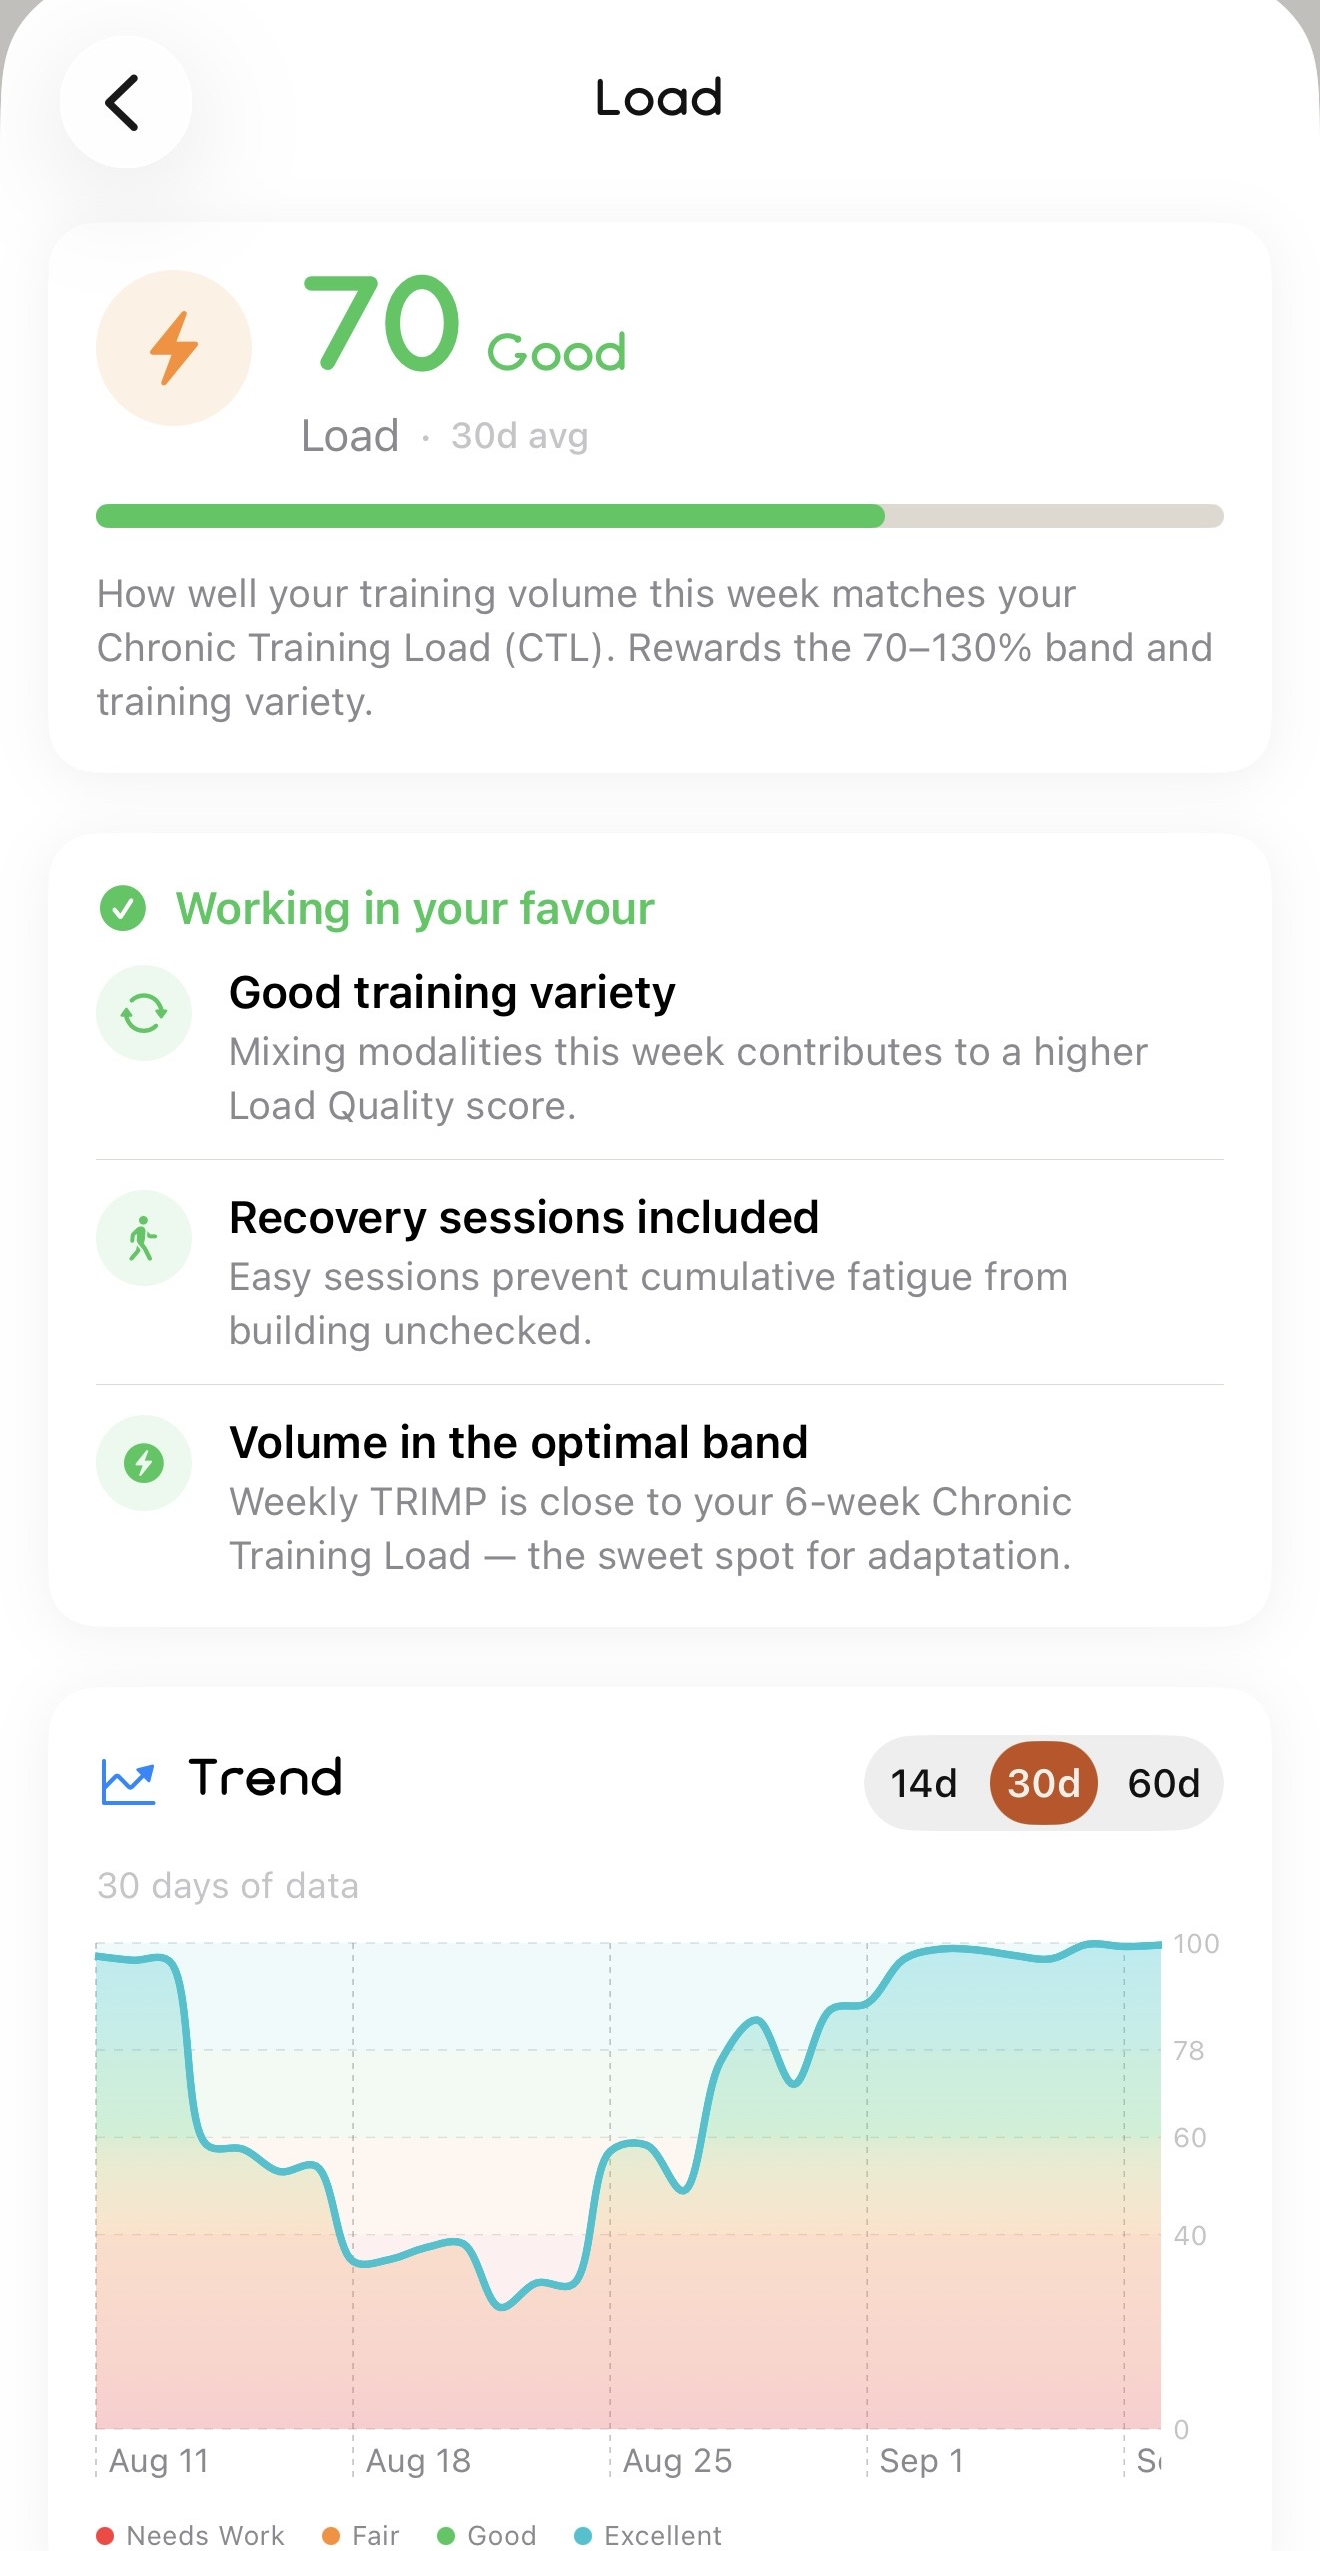
Load Quality · 35%
Whether this week's volume fits
How well your weekly training matches your 42-day Chronic Training Load. Rewards the 70 to 130% band and training variety.
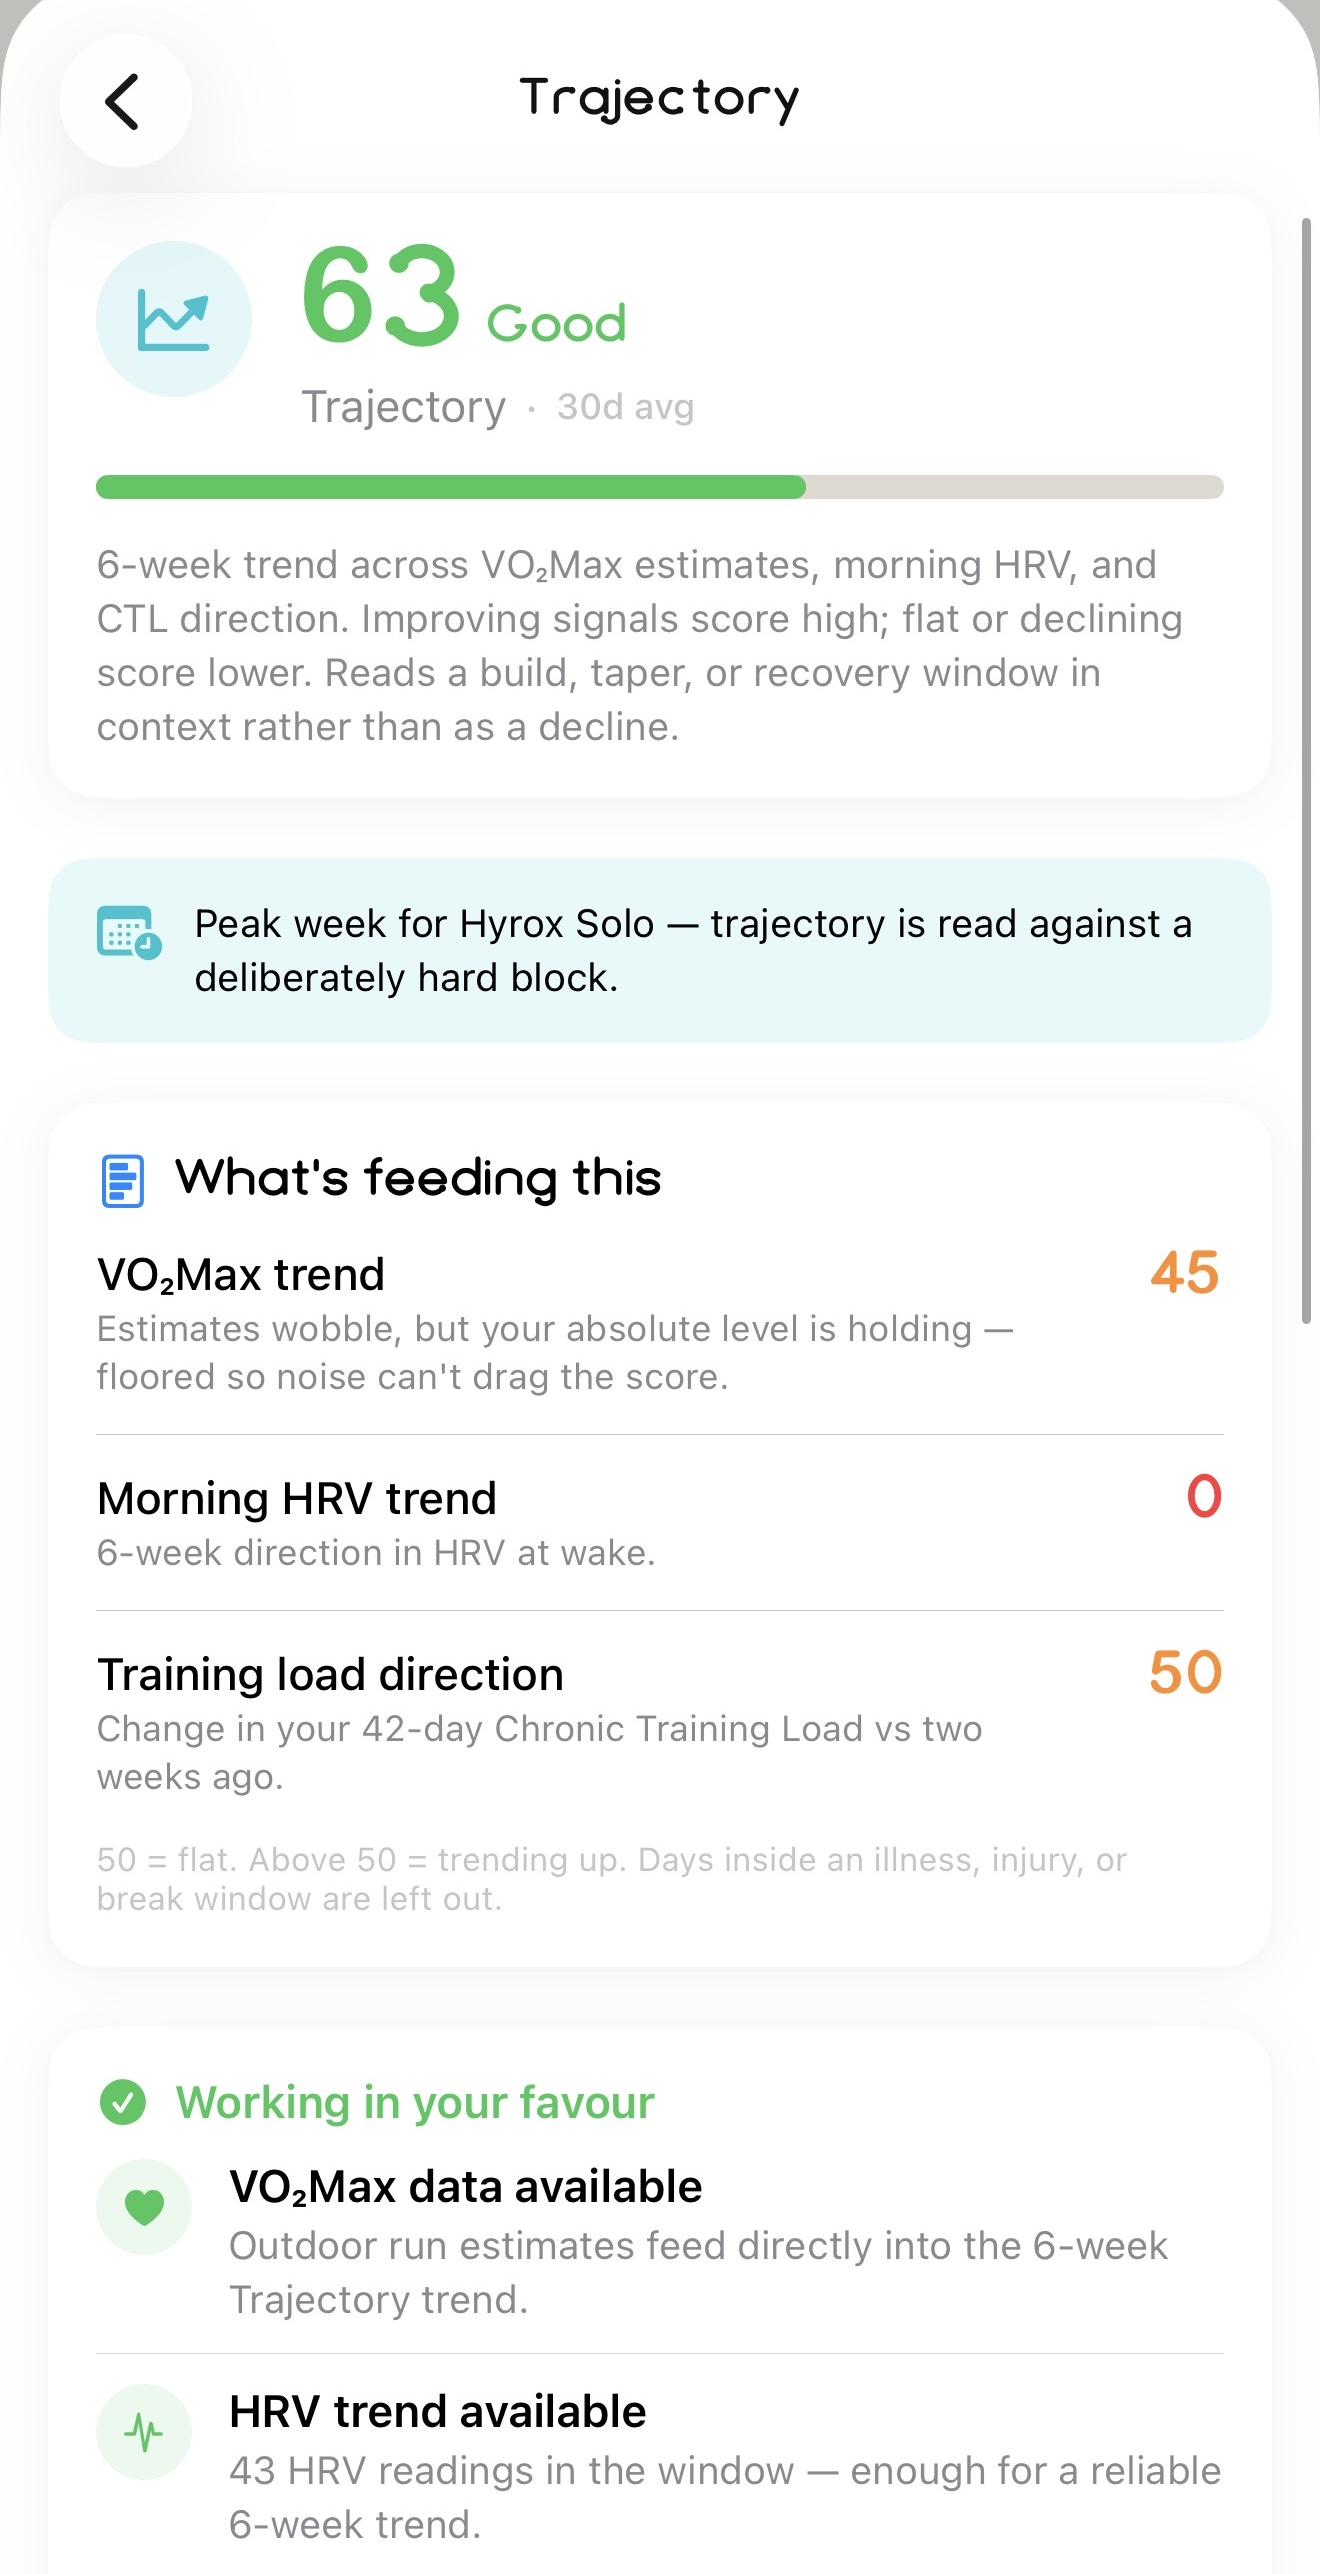
Trajectory · 25%
The direction you're heading
The 6-week trend across VO₂ Max, morning HRV and training-load direction. A build or a taper is read in context, not as a decline.
Completing your daily Recovery Actions adds a small bonus on top. Skipping them never subtracts, so there is only upside to trying.
Reading the number
Where your score sits, and what it means.
Most active people land between 60 and 80. Above 78, your recovery, training load and long-term trend are all working together.
Making sense of your score
A lower score after a hard week is not a warning.
A dip after a hard training block is the pillar breakdown doing its job. It tells you which pillar moved, and whether that was expected.
First
See which pillar is down
Load Quality falling after a big week is expected. Readiness low when you have not trained hard is worth a closer look.
Then
Read it in context
Enva knows if you are in a build, a taper or a race week, and reads the trend against that instead of flagging a decline.
Watch for
Readiness recovering
When Readiness climbs back while Load Quality stays high, your body is adapting. That is the signal you want.
Every score shows its work
The reasoning, and the confidence.
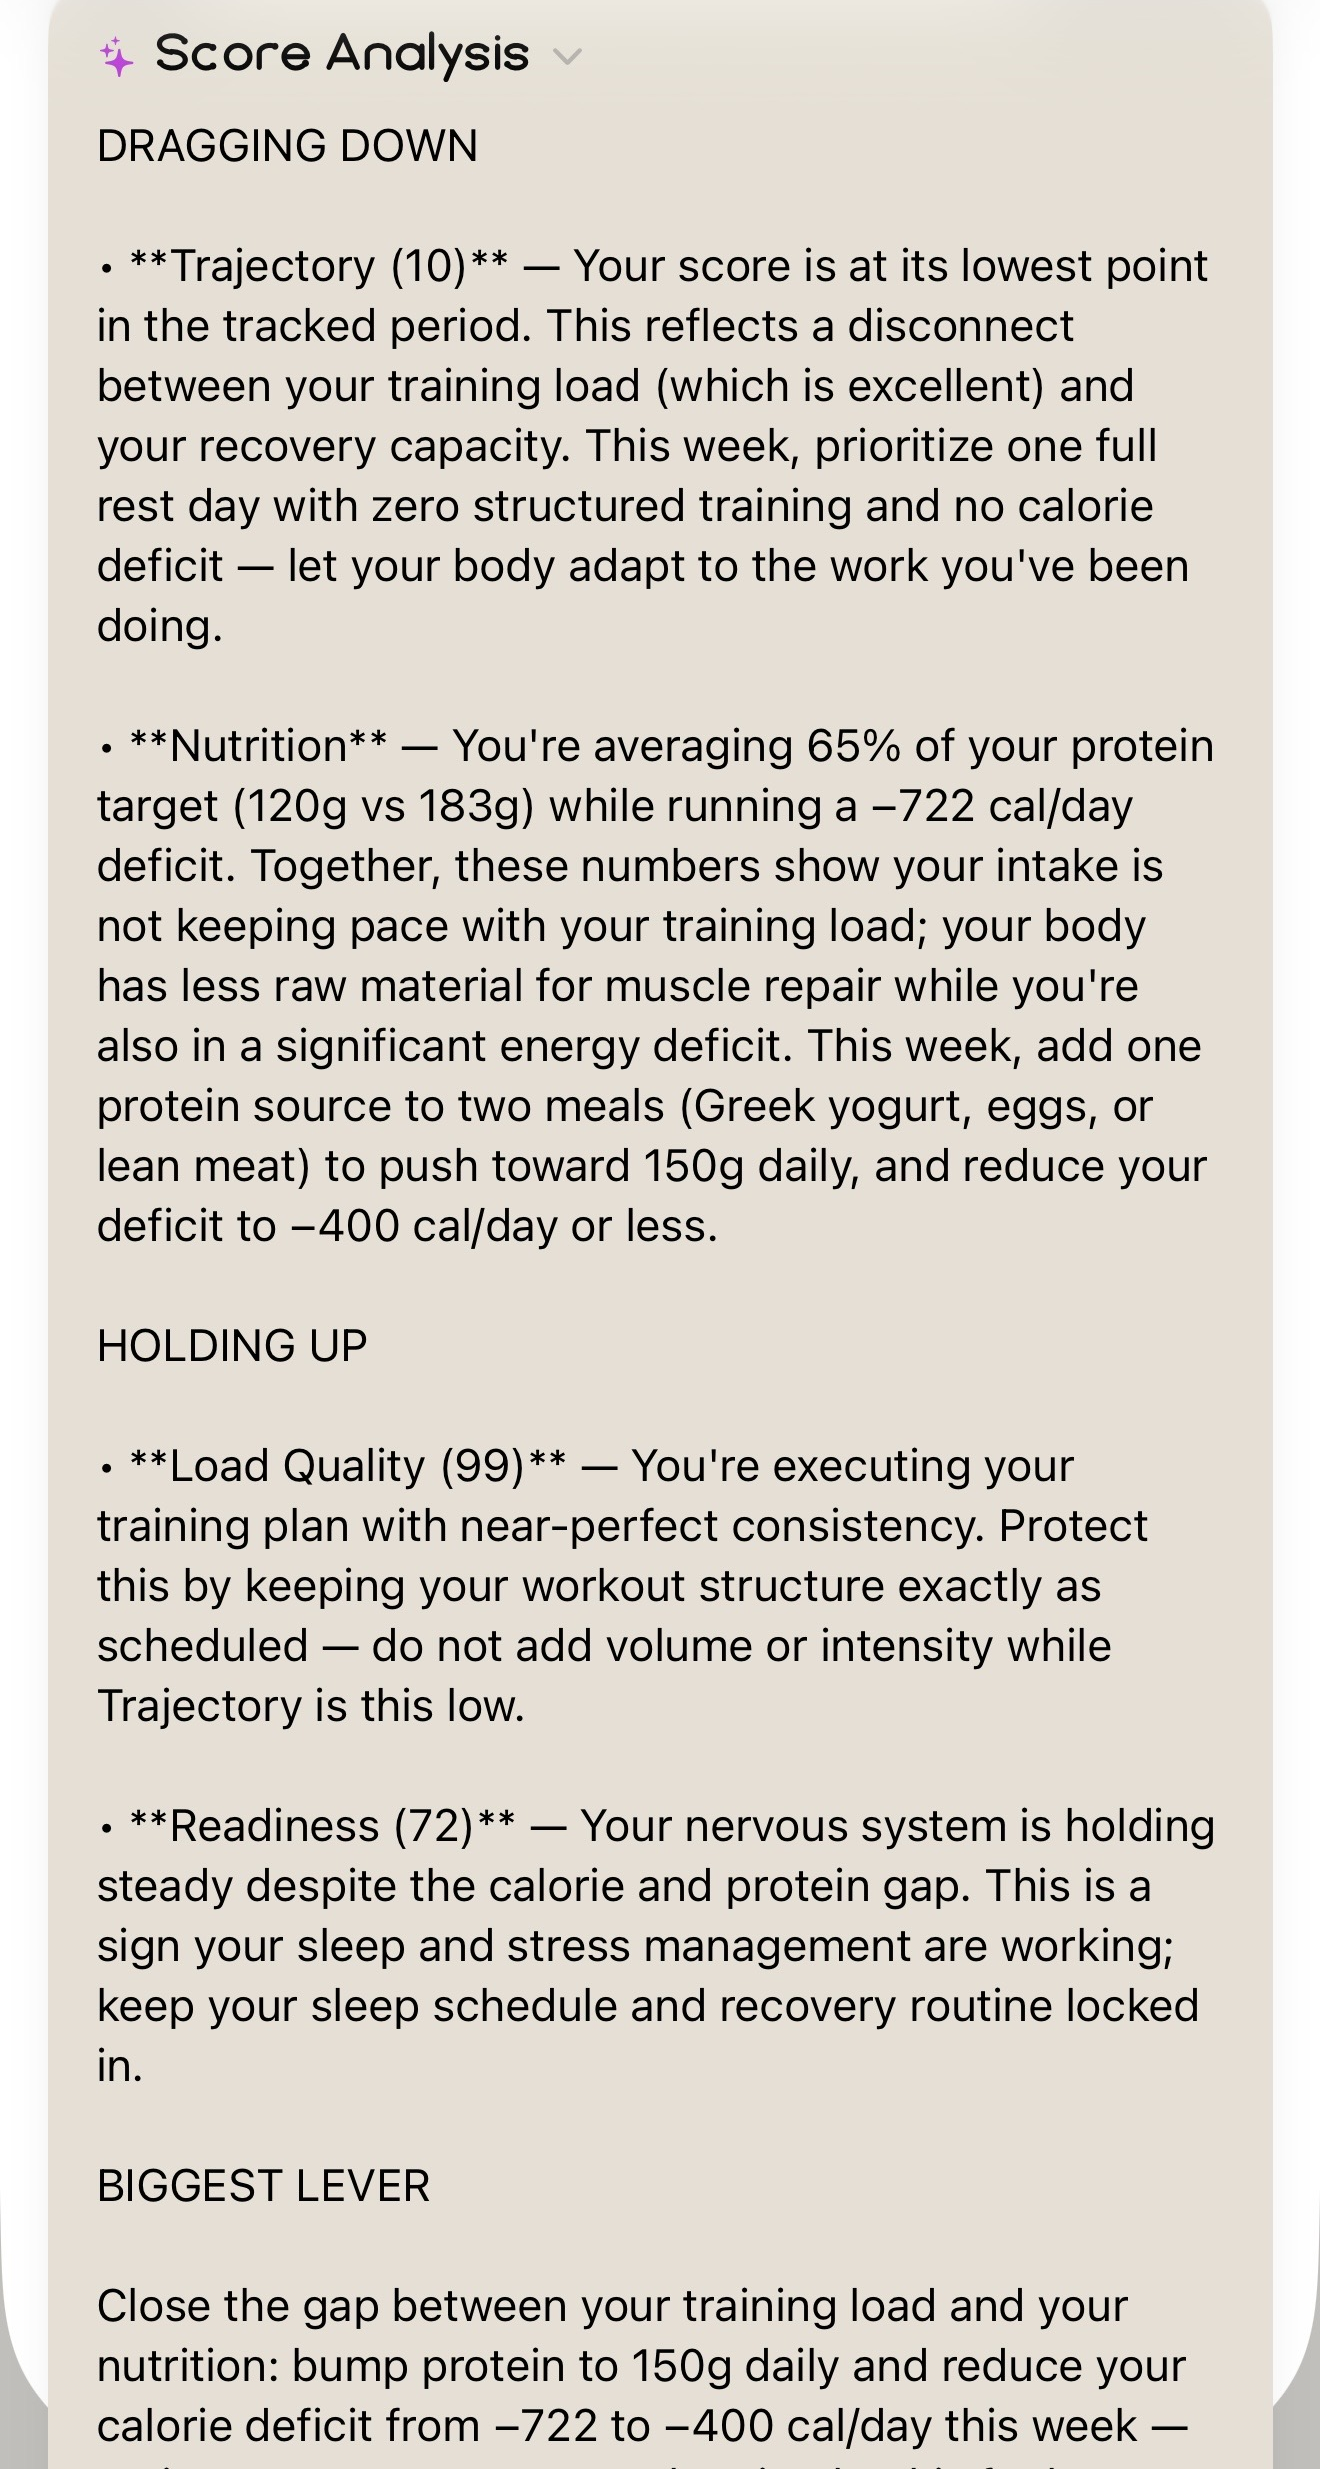
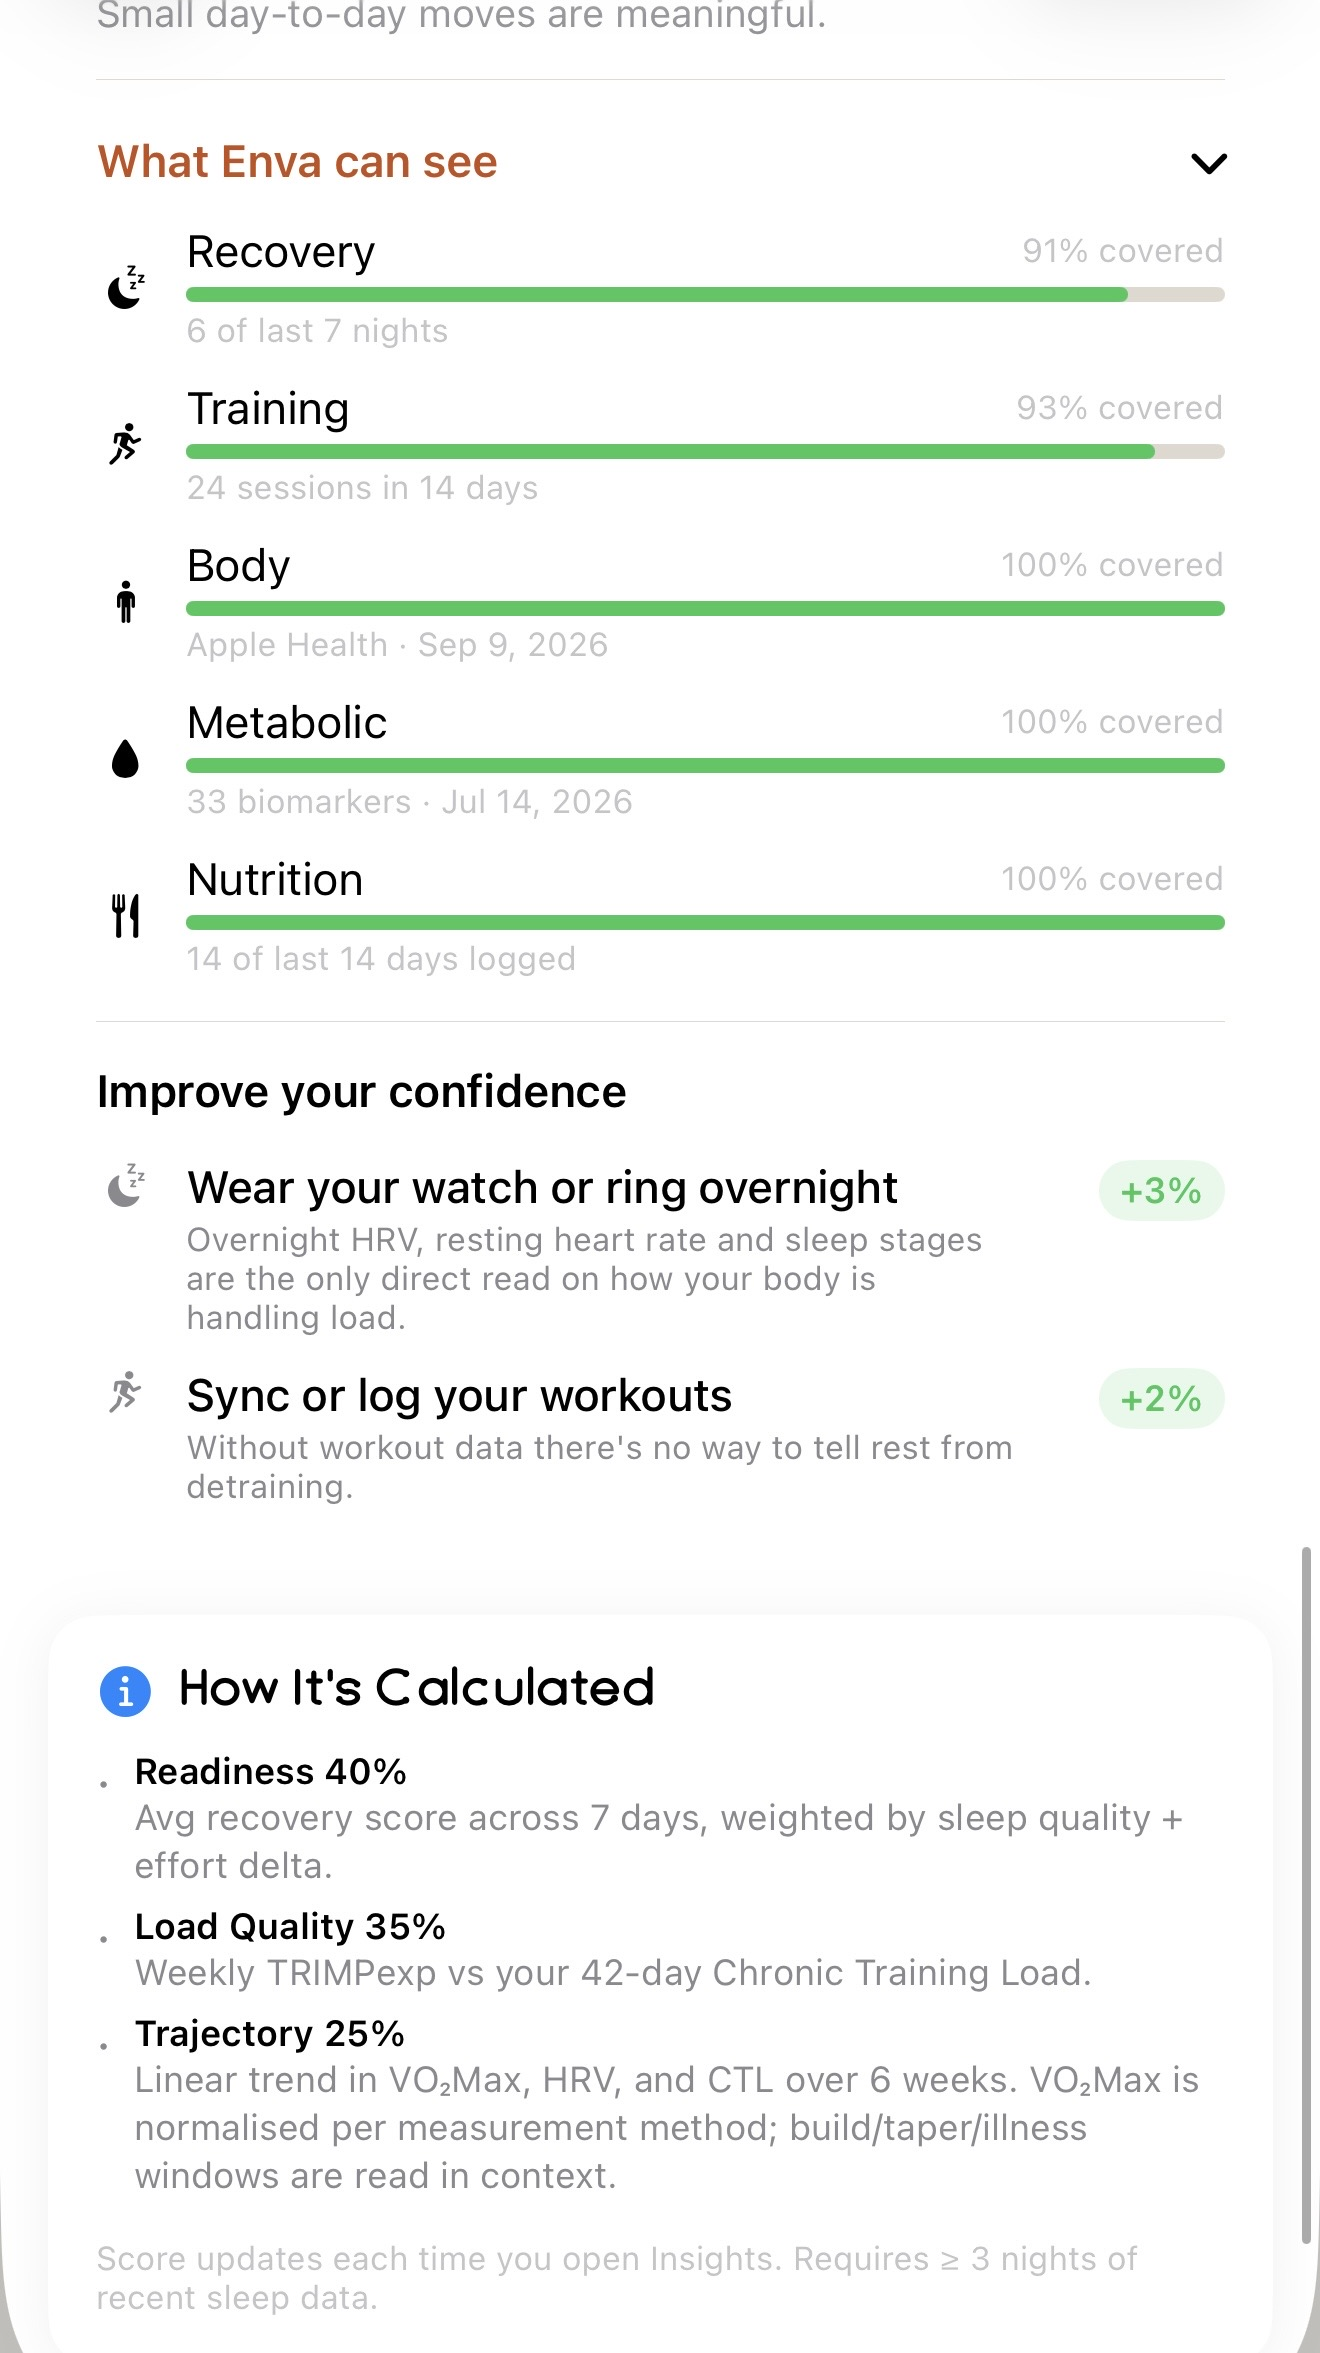
Tap the score and Enva Intelligence breaks down what is dragging it down, what is holding it up, and the single biggest lever. Next to it: exactly how much of your data the score is standing on.
How it's calculated
The formula, in full.
Average recovery score across 7 days, weighted by sleep quality and effort delta.
Weekly TRIMPexp against your 42-day Chronic Training Load.
Linear trend in VO₂ Max, HRV and CTL over 6 weeks. VO₂ Max is normalised per measurement method; build, taper and illness windows are read in context.
The score updates each time you open Insights, and needs at least three nights of recent sleep data to show.
See your score
Available soon on the App Store.
One email when it's ready. No spam.
Coming soon to iPhone.