Your data

Your numbers, scored against you.

Enva compares you with your own baseline, not a population chart. It turns what your body does into a number for this week, a number for the long run, and a plan for today.

Health Score

One number for how this week is going.

Your watch shows resting heart rate, HRV, sleep and VO₂ Max each on its own. The Enva Health Score reads them together, in three pillars, each scored against your own baseline.

Readiness40%

How recovered you are. A 7-day average of recovery, weighted by sleep quality and the training load before it.

Load quality35%

Whether this week's volume fits. Your weekly training against what your body is used to over the last 42 days.

Trajectory25%

The direction you're heading. The 6-week trend in VO₂ Max, HRV and training load. A build or a taper is read in context, not as a decline.

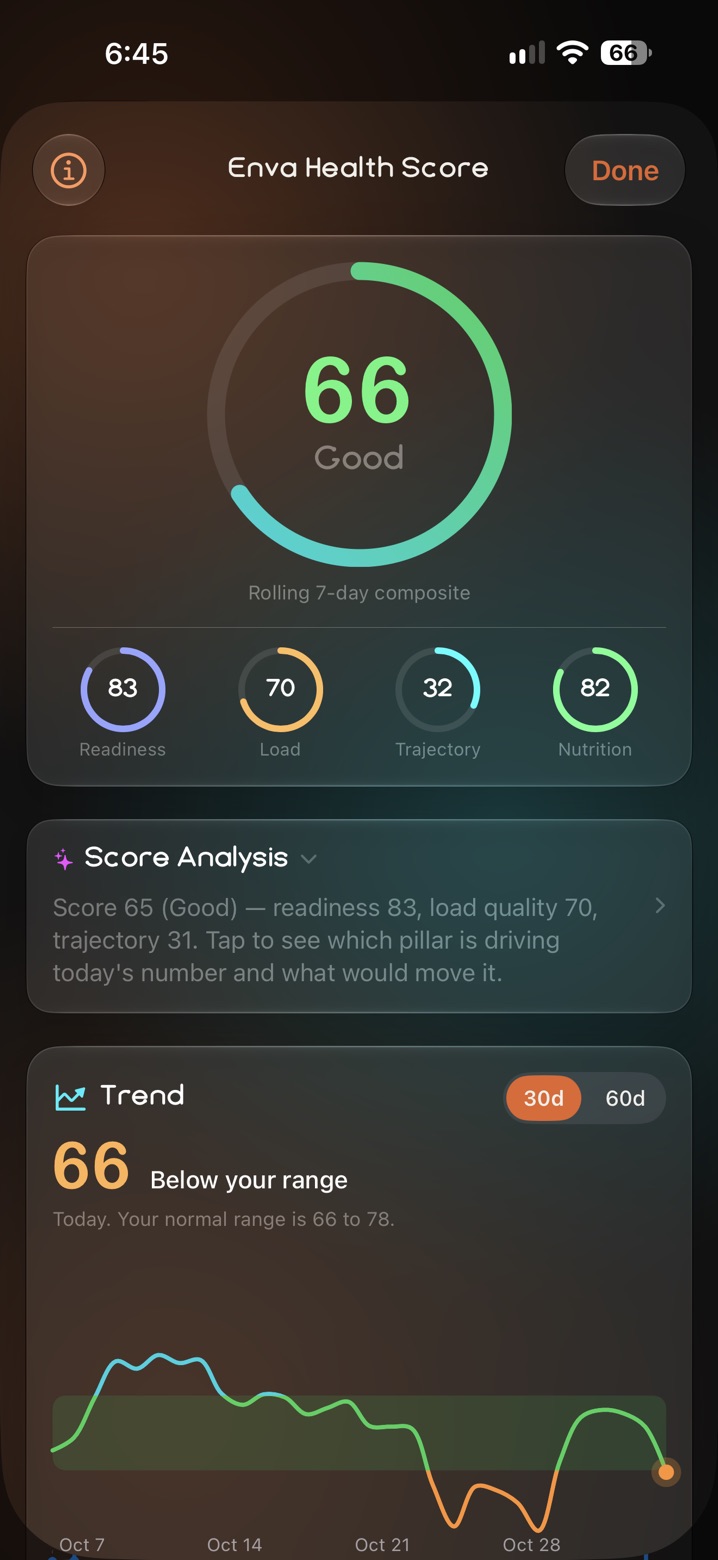
Health Score screen with its pillar breakdown

Where your score sits.

A lower score after a hard week is not a warning. It is the pillar breakdown doing its job. See which pillar is down first: load quality dropping after a big week is expected, while readiness dropping when you have not trained hard is worth a closer look. When readiness climbs back while load quality stays high, your body is adapting.

Tap the score and Enva Intelligence explains what is pulling it down, what is holding it up, and the single biggest lever.
Biological Age

A number that moves.

Your chronological age is a fact about the calendar. Your biological age is an estimate of how your body is functioning, and unlike the first one, it changes with how you live.

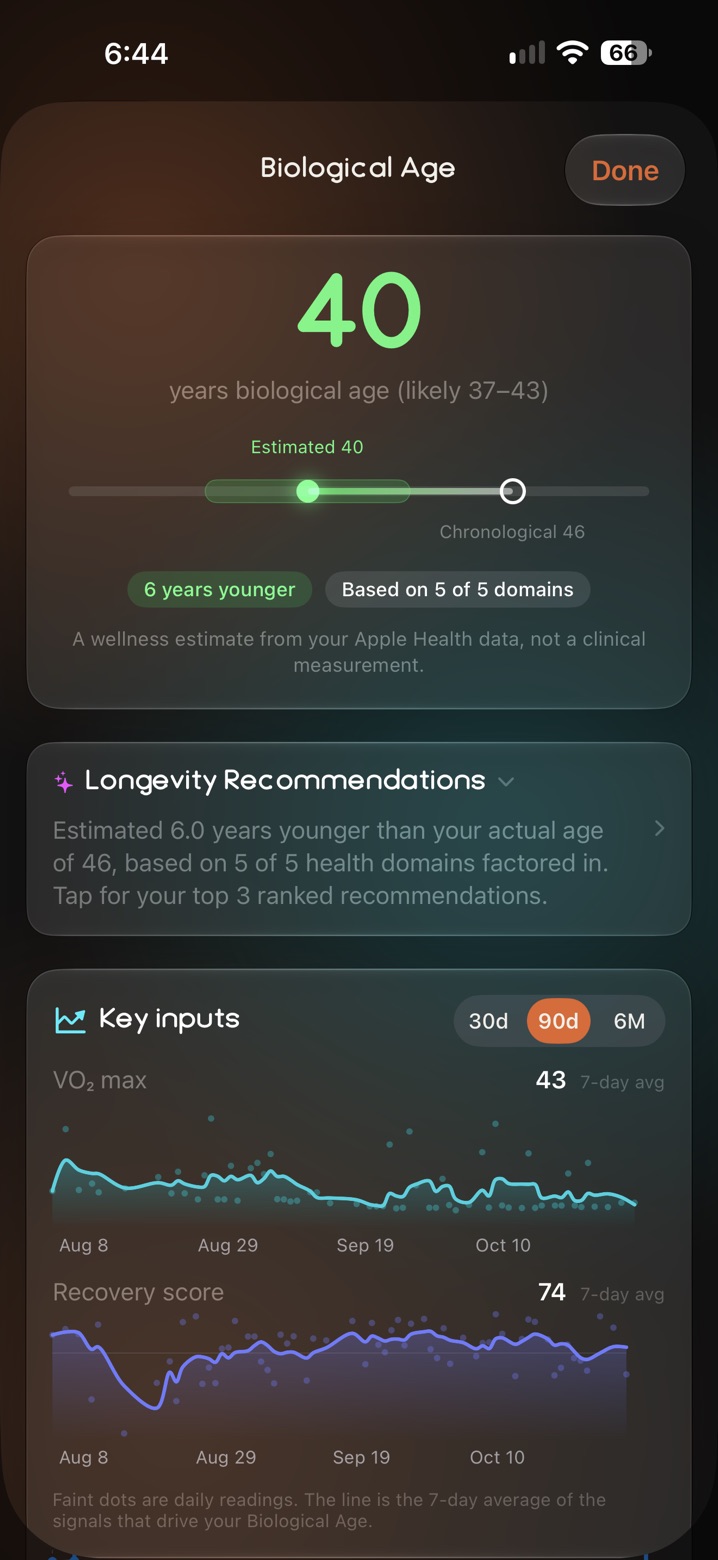
Enva builds it from five weighted domains of your own data, and tells you how much to trust the answer.

Biological Age screen with its confidence and the domains behind it
Cardiovascular fitness30%

How efficiently your heart and lungs move oxygen. The heaviest weight, because it is one of the strongest modifiable predictors of long-term survival.1,2

  • VO₂ Max
  • Resting heart rate
  • HRV
Recovery capacity20%

Whether your body repairs between sessions. Sleep stages count, not just hours.

  • Heart rate recovery
  • Deep and REM sleep
  • Sleep duration and consistency
Activity profile20%

Not just how much you move, but the shape of it. An athlete who only ever goes hard is not aging the way the volume suggests.

  • Time in zones
  • Cardio and strength sessions
  • Variety
  • Daily steps
Body composition15%

Lean mass is the part that predicts. In older adults, more muscle relative to height is linked to longer survival.3,4

  • Body fat
  • Lean mass
  • Muscle index
Lab biomarkers15%

Your labs, read as a system instead of a PDF, folded into the same number as your training.

  • ApoB and LDL
  • HbA1c and glucose
  • hsCRP
  • And more

A model that admits what it doesn't know.

  1. Score each domain. Every domain makes its own age estimate from its own signals. A domain with no data makes nothing, not a guess.
  2. Reweight to what is present. If you have never added labs, the other four domains share the weight. You are never penalized for data you don't have yet.
  3. Show a range. More data means a narrower range and higher confidence. With nothing to stand on, Enva shows no estimate at all.
Not a DNA testEnva does not read your genes. It estimates from what your body does: fitness, recovery, activity, body composition and labs.
Not a diagnosisA biomarker outside its reference range is a reason to talk to a clinician, not a conclusion.
Not a score to gameThe domains are weighted by predictive value, not by how easy they are to move.
Sleep and recovery

Last night, and whether you're ready today.

Someone whose deep sleep averages 45 minutes should not be scored against someone who averages 80. Enva scores each night against your own rolling baseline, so the model learns your biology and not a stranger's.

Wrist temperature is confirmatory. A shift from your baseline flags physiological stress and holds back the rest-day boost, whatever the sleep stages show.

Sleep feeds recovery. Recovery sets the day.

Recovery takes the same overnight signals, adds yesterday's training load, and answers a different question: is your body in a position to absorb today's work? A 7-day view shows whether a low reading is an off night or a trend.

A low Recovery score is not a warning. High recovery on a rest day is exactly right, and low recovery after a hard block means the training is doing its job. A rolling 7-day average of Recovery is also the Readiness pillar of your Health Score, so one bad night does not crater it, and a run of them shows up as it should.

Today's plan

You can't control recovery. You can control today.

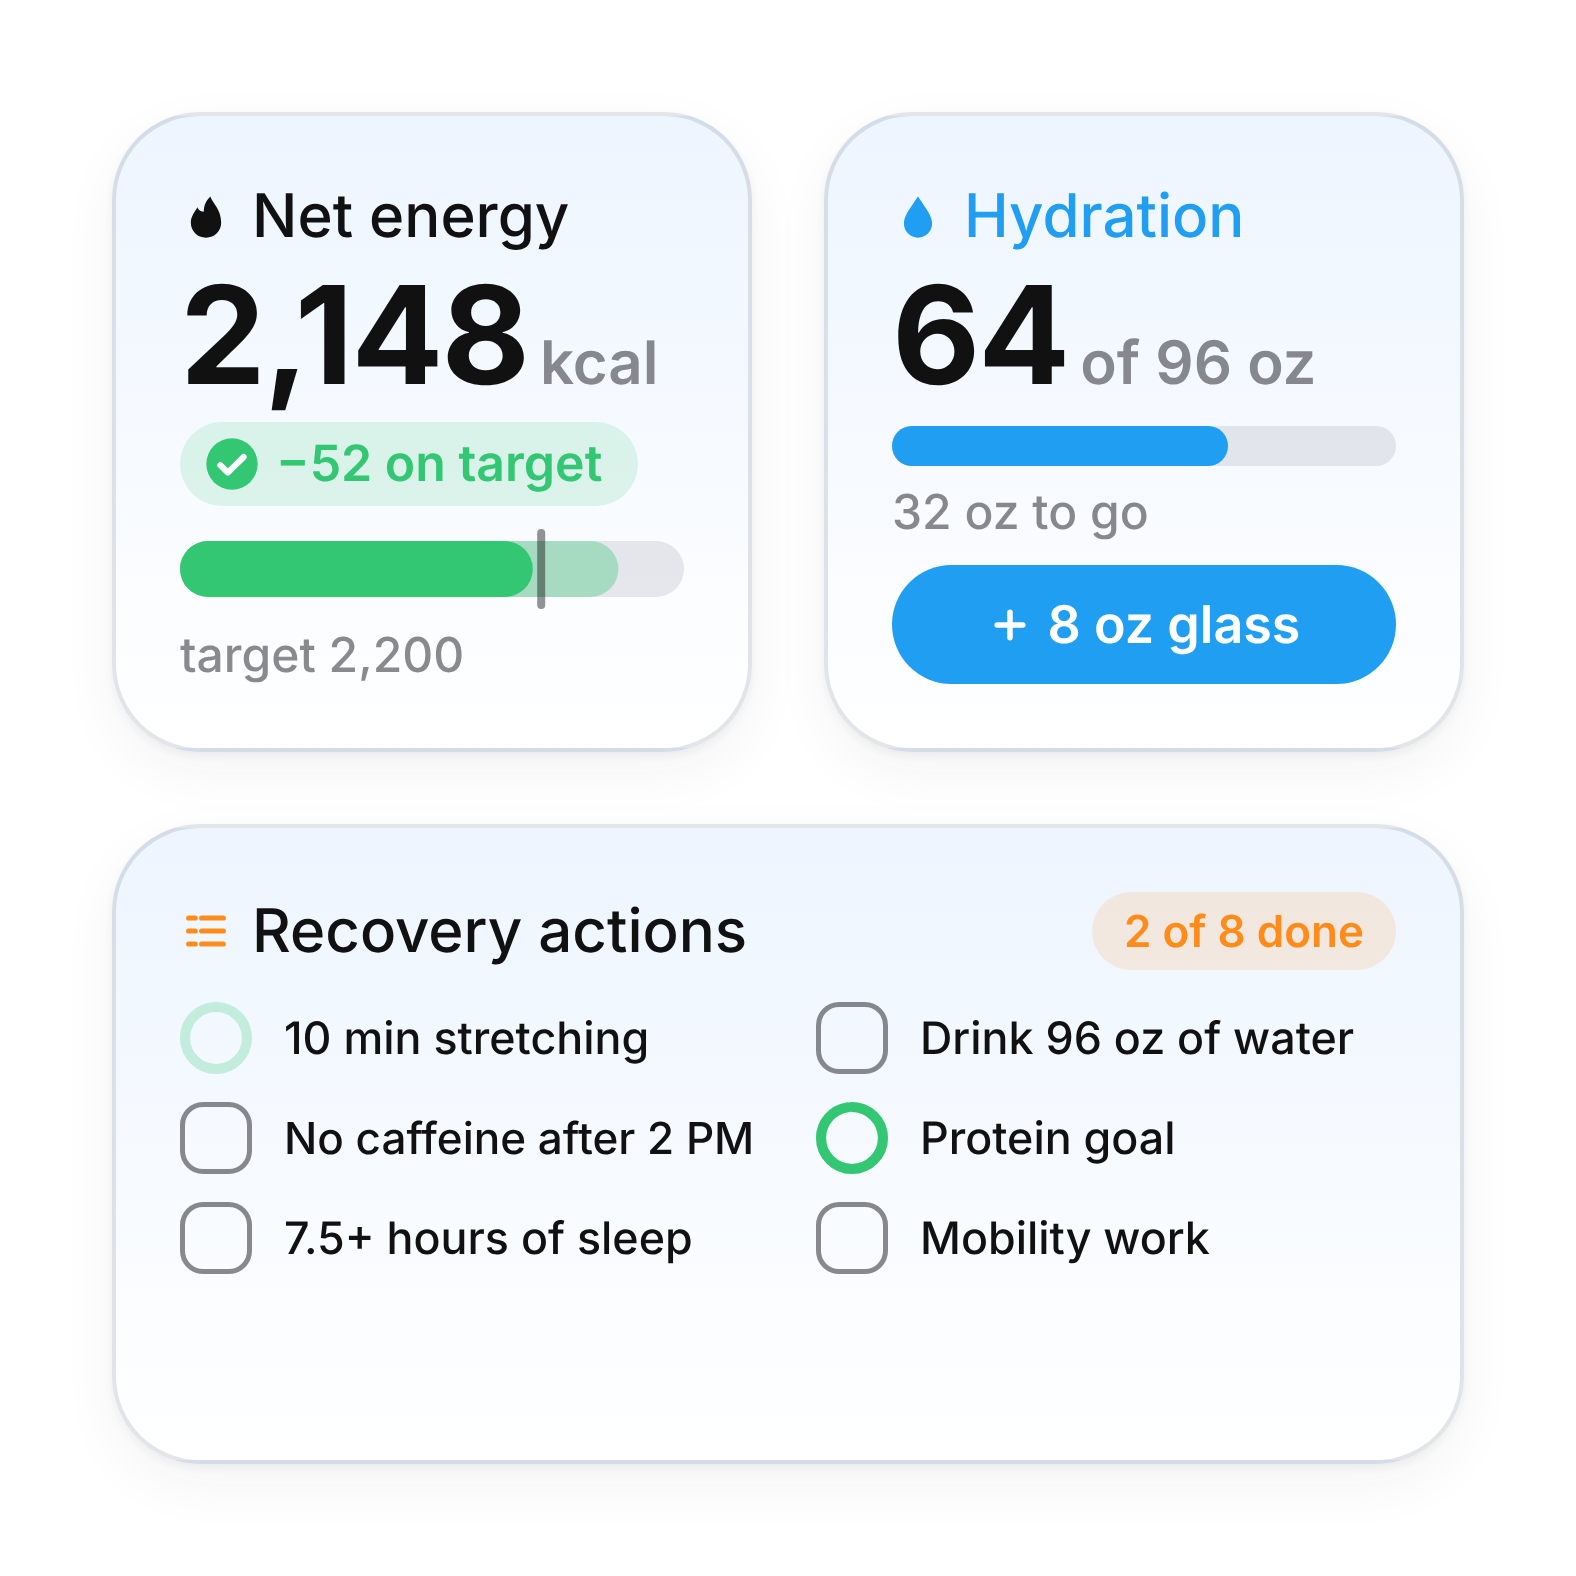
Your Recovery score is a readout, not a dial. Recovery Actions is the input side: a short daily checklist drawn from your own morning numbers.

  • Some items check themselves, like your protein goal.
  • You tick the rest: caffeine cut-off, daylight, sleep and water.
  • It sits on your Home Screen as a widget, so you can tick as you go.
A Recovery actions checklist widget next to Net energy and Hydration widgets
How it fits together

Each number feeds the next.

  1. Sleepscores the night against your own baseline.
  2. Recoveryturns the night and yesterday's load into a read on today.
  3. Health Scoreaverages recovery over 7 days as its Readiness pillar.
  4. Biological Agedraws on heart rate recovery and sleep stages for its recovery domain.

Estimates, not diagnoses.

Enva is a wellness app, not a medical device. Nothing here is medical advice, and a number outside its usual range is a reason to talk to a clinician, not a conclusion.

Sources

  1. Mandsager K, et al. Association of Cardiorespiratory Fitness With Long-term Mortality Among Adults Undergoing Exercise Treadmill Testing. JAMA Network Open. 2018;1(6):e183605. doi:10.1001/jamanetworkopen.2018.3605
  2. Kodama S, et al. Cardiorespiratory fitness as a quantitative predictor of all-cause mortality and cardiovascular events in healthy men and women: a meta-analysis. JAMA. 2009;301(19):2024-2035. doi:10.1001/jama.2009.681
  3. Srikanthan P, Karlamangla AS. Muscle mass index as a predictor of longevity in older adults. The American Journal of Medicine. 2014;127(6):547-553. doi:10.1016/j.amjmed.2014.02.007
  4. Cruz-Jentoft AJ, et al. Sarcopenia: revised European consensus on definition and diagnosis. Age and Ageing. 2019;48(1):16-31. doi:10.1093/ageing/afy169
Early access

See where you actually stand.

Join the waitlist and be first to know when Enva launches.

You're on the list. We'll email you before launch.

Coming soon to iPhone and Apple Watch.